Forex Technical Analysis: Learning to Draw and Use Trend Lines
In technical analysis, determining the current market "trend" is a crucial first step."The trend is your friend," trading with the trend often increases the odds of success.
Besides observing price structures (highs and lows) and using moving averages, drawing "trend lines" is another very common, intuitive, and effective method to help us identify and track market trends.
A trend line is the slanting line you see on a price chart; it not only clearly marks the main direction of the market but also provides potential support or resistance references during the continuation of the trend.
Learning how to correctly draw and interpret trend lines is a fundamental skill every technical analysis learner should master.
This article will introduce how to draw uptrend and downtrend lines, their functions, and how to use them to find trading clues.
1. What is a Trend Line? The "Track Line" of a Trend
A trend line is a straight line drawn on a price chart that connects a series of progressively higher lows (used for uptrends) or a series of progressively lower highs (used for downtrends).Purpose: Its main purpose is to visually present the current primary direction of the market and, like a "track," indicate the possible path and boundaries where the trend may continue.
Function: An effective trend line can act as a dynamic support level (uptrend line) or a dynamic resistance level (downtrend line) during the trend's progression.
2. How to Draw Trend Lines? Connecting Key Points
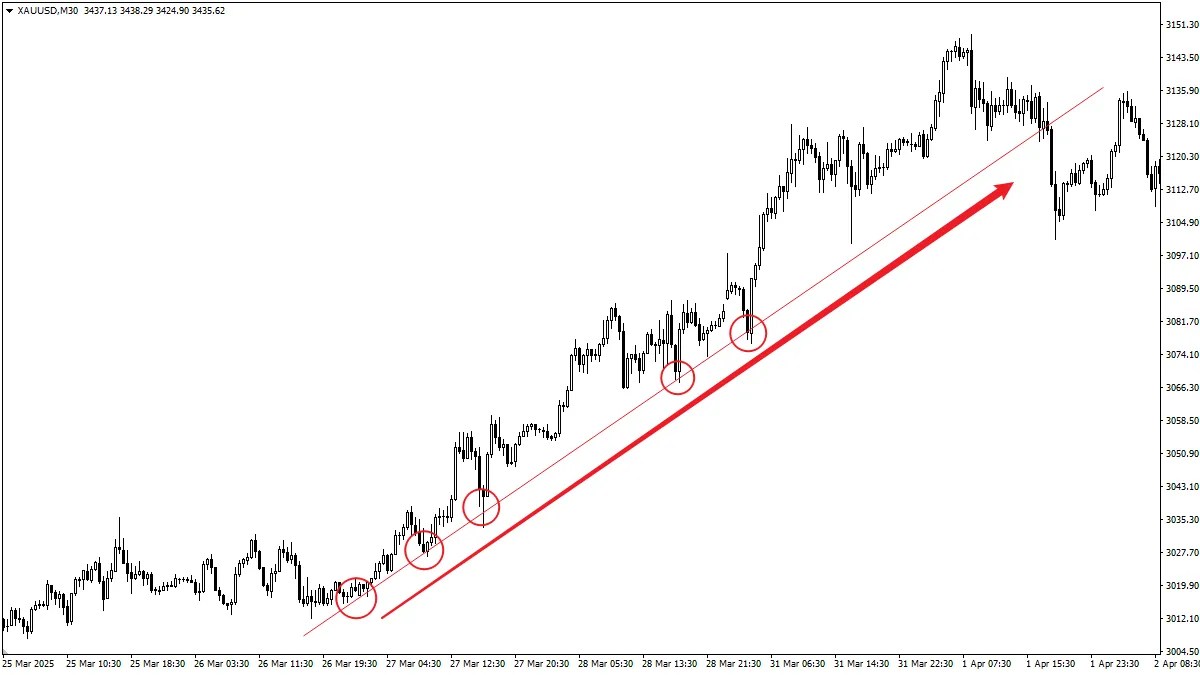
The basic rules for drawing trend lines are simple:- Uptrend Line:
- In a clear uptrend, find at least two significant swing lows that are progressively higher.
- Connect these two (or more) lows with a straight line and extend it upward to the right.
- This line should be below the price chart, acting as "support" for the rising price.
- Validity: An uptrend line connecting three or more lows is generally considered more reliable and effective.
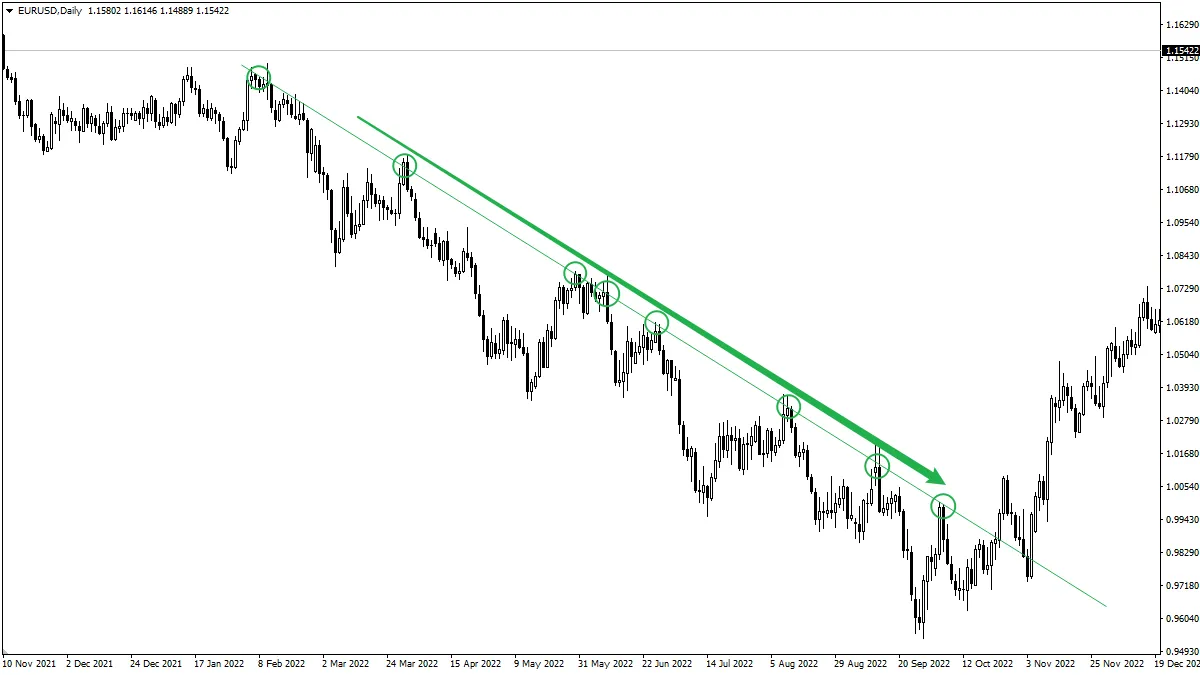
- Downtrend Line:
- In a clear downtrend, find at least two significant swing highs that are progressively lower.
- Connect these two (or more) highs with a straight line and extend it downward to the right.
- This line should be above the price chart, acting as "resistance" suppressing the price decline.
- Validity: Similarly, a downtrend line connecting three or more highs is generally considered more reliable.
- Key Points for Drawing:
- At least two points: Theoretically, two points define a straight line, but connecting three or more points is more meaningful.
- Avoid crossing the body: Ideally, the trend line should only touch the wicks (shadows) of the candlesticks, avoiding significant crossing of the candlestick bodies.
- Do not force drawing: If there are no clear, connectable valid highs or lows on the chart, do not force drawing a trend line.
- Subjectivity exists: Choosing which highs or lows to connect can sometimes be subjective. Different traders may draw slightly different trend lines. The important thing is to maintain consistency in your drawing standards.
3. Functions and Interpretation of Trend Lines
Once a seemingly valid trend line is drawn, traders pay attention to the following points:- Confirming Trend Direction: This is the most basic function. An upward sloping trend line intuitively confirms an uptrend; a downward sloping one confirms a downtrend.
- Acting as Dynamic Support/Resistance:
- Uptrend Line: When the price pulls back near the trend line during an uptrend, the line may provide support. Traders observe whether the price stops falling and rebounds here, looking for potential trend-following buy opportunities (confirmation with candlestick patterns is needed).
- Downtrend Line: When the price rebounds near the trend line during a downtrend, the line may provide resistance. Traders observe whether the price meets resistance and falls back here, looking for potential trend-following sell opportunities (confirmation with candlestick patterns is needed).
- Reflecting Trend Strength (Reference): The slope of the trend line can somewhat reflect the strength of the trend. Very steep trend lines usually indicate strong momentum but may be hard to sustain; gentler slopes indicate a more moderate and stable trend.
4. The Significance of Trend Line Breakouts: Warning of Trend Changes?
When the price decisively closes beyond a previously valid trend line (not just briefly touching it intraday) —for example, closing below an uptrend line or closing above a downtrend line—this is often seen as a potential signal indicating:- The current trend may be weakening.
- The market may enter a sideways consolidation phase.
- Or even, the original trend may be about to reverse.
Important Reminder:
- Trend line breakout ≠ guaranteed trend reversal! False breaks are also very common, where the price briefly breaks the trend line but then returns to the original trend direction.
- Confirmation needed: Whether a trend line breakout signal is reliable usually requires confirmation from other signals. For example: Has an important horizontal support/resistance level also been broken?
Has a reversal chart pattern formed?
Are there supporting indicator signals like MACD crossovers or RSI divergences? - A trend line breakout is essentially a form of "breakout trading" and should be treated cautiously.
5. Are Trend Lines Suitable for Beginners?
Yes, absolutely! Learning to draw and understand basic trend lines is one of the most fundamental and essential skills for beginners learning technical analysis.- Advantages: The concept is intuitive, easy to visualize on charts, and helps beginners understand the concept of trends well.
- Challenges for Beginners: Choosing the correct points to draw lines may require practice, as well as learning how to handle false breakouts.
Suggestions:
- Start practicing with clear trends, preferably on longer timeframes (such as daily charts D1 or 4-hour charts H4), because trend lines on longer timeframes are usually more reliable.
- Look for trend lines with at least three obvious touch points.
- Use trend lines mainly as tools to judge trend direction and find potential dynamic support/resistance areas.
- Do not enter trades just because the price touches the trend line. Wait for clear reaction signals near the trend line (e.g., bullish/bearish candlestick patterns) as confirmation.
- Also seek confirmation for trend line breakouts; do not blindly chase trades.
- Always use stop-loss orders for risk management.
Conclusion
Trend lines are a simple and practical tool in technical analysis, drawn by connecting key lows (for uptrends) or highs (for downtrends) on price charts to depict the trend direction and provide dynamic support or resistance references.Learning to correctly draw and interpret trend lines, and understanding what it may mean when price touches or breaks a trend line, is foundational for beginners to build chart analysis skills.
Although drawing trend lines involves some subjectivity and signals require confirmation, they remain a powerful tool for judging market direction and finding potential trading zones.
Be sure to combine trend line analysis with other technical tools and strict risk management.