Understanding Forex K-Line Charts (Candlestick Charts): The Basic Language for Interpreting Price Stories
When you open any forex trading platform, the first thing you often see occupying most of the screen is a price chart composed of alternating red and white or green and red "bars".This type of chart is called a "K-Line Chart" or "Candlestick Chart", which is the most commonly used tool by forex traders worldwide to observe and analyze market price movements.
Compared to simple line charts that only show closing prices connected by lines, K-Line charts provide richer market information.
Each "K-Line" or "candlestick" is like a small storybook, recording the battle of buying and selling forces within a specific time period.
Learning how to read K-Line charts is the first step in mastering technical analysis and price action trading.
This article will break down the components of a single K-Line, explain the meanings of different colors and shapes, and help you grasp how to understand this fundamental market language.
1. What is a K-Line Chart / Candlestick Chart?
A K-Line Chart is a type of financial chart used to display the price movements of an asset (such as a currency pair) within a specific Time Period.This time period can be any length you choose, such as 1 minute, 5 minutes, 1 hour, 4 hours, 1 day, 1 week, or 1 month.
Each K-Line (or candlestick) on the chart represents the price performance during that time period.
It is called a "Candlestick Chart" because its shape usually includes a rectangular "Real Body" and thin "Shadows" extending above and below, resembling a candle with a wick.
2. Reading a Single K-Line: Recording Four Key Prices
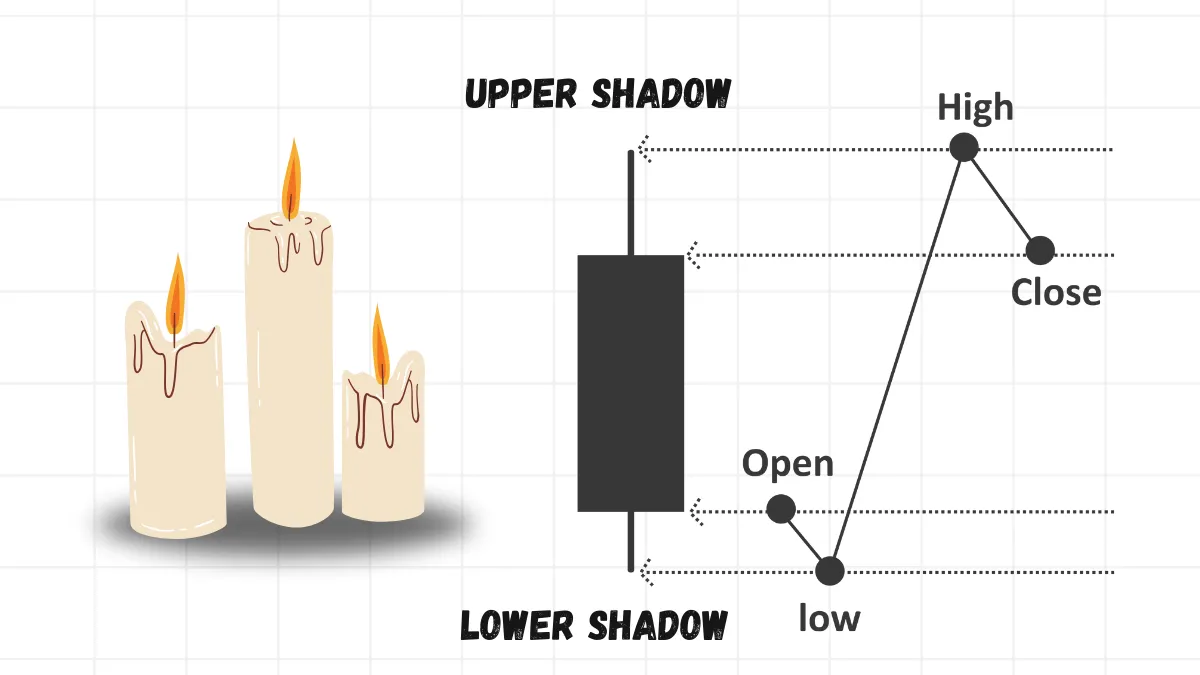
Each individual K-Line contains four key price points within that time period:- Open Price (Open): The first transaction price at the start of the time period.
- High Price (High): The highest price reached during the time period.
- Low Price (Low): The lowest price reached during the time period.
- Close Price (Close): The last transaction price at the end of the time period.
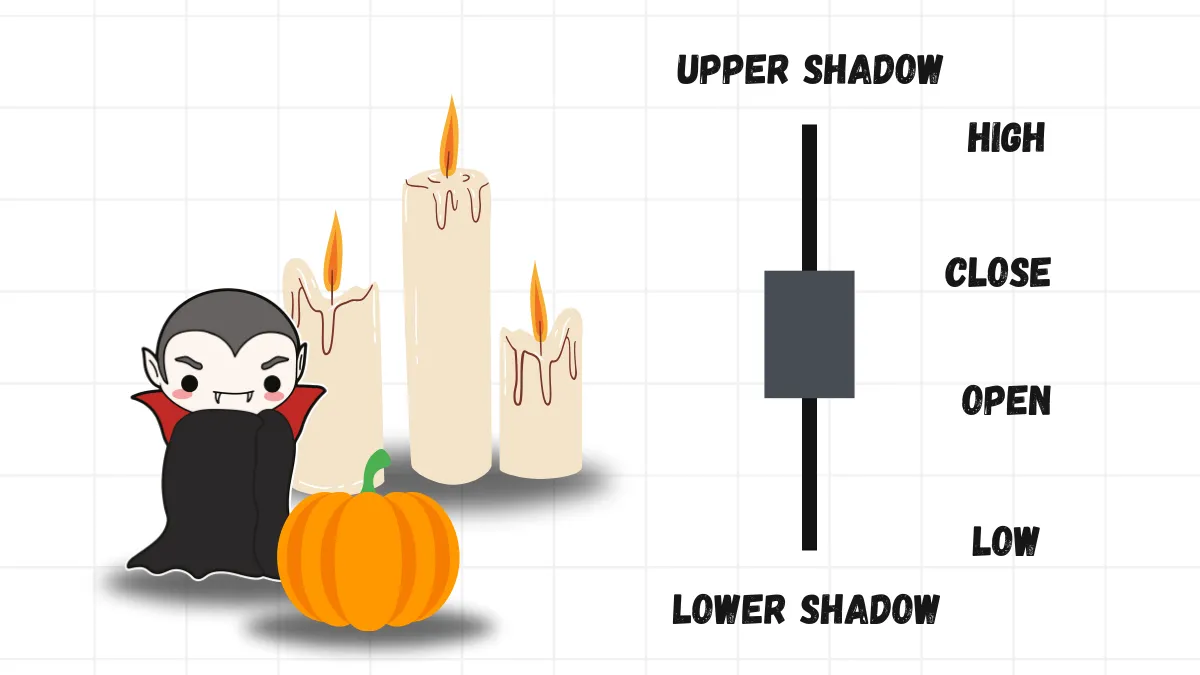
These four prices are presented through two main parts of the K-Line:
- Real Body (Candle Body): The thicker rectangular part in the middle. Its top and bottom represent the open and close prices respectively.
- Shadow / Wick: Thin lines extending from the top and bottom of the real body.
- Upper Shadow: The line segment from the top of the real body to the high price. It shows the highest point the price reached during this period.
- Lower Shadow: The line segment from the bottom of the real body to the low price. It shows the lowest point the price reached during this period.
3. Meaning of Colors: Did the Price Rise or Fall During This Period?
The color of the K-Line real body (or whether it is hollow/solid) is usually used to quickly distinguish whether the overall price rose or fell during this time period:- Bullish Candle (Upward K-Line):
Usually shown in green or white (hollow).
Indicates that the Close Price (Close) is higher than the Open Price (Open) for that period. This means the price generally rose during this time.
The bottom of the real body is the open price, and the top is the close price. - Bearish Candle (Downward K-Line):
Usually shown in red or black (solid).
Indicates that the Close Price (Close) is lower than the Open Price (Open) for that period. This means the price generally fell during this time.
The top of the real body is the open price, and the bottom is the close price.
(Note: Color settings can usually be customized on most trading platforms according to personal preference. The key is to understand which color represents rising prices and which represents falling prices.)
4. K-Line Patterns: The "Emojis" of Price Action
The shape of a single K-Line (such as the size of the real body and the length of the shadows) and the combination of multiple consecutive K-Lines are considered by technical analysts and price action traders to reflect market sentiment, the balance of buying and selling forces, and may indicate potential future price directions.This is known as "K-Line Patterns" or "Candlestick Patterns".
Simple examples to understand the information:
- Long Real Body K-Line: A long green real body (bullish candle) may indicate very strong buying power. A long red real body (bearish candle) may indicate selling power dominance.
- Long Upper/Lower Shadows: A long upper shadow (thin line above) indicates the price pushed high but fell back before closing, suggesting selling pressure above. A long lower shadow (thin line below) indicates the price dropped deeply but was pulled back before closing, suggesting buying support below.
- Doji: The open and close prices are very close, resulting in a very small real body, sometimes just a horizontal line. This usually indicates a balance of buying and selling forces, market hesitation, and may signal a pause or potential reversal in the trend.
Important Note: K-Line pattern analysis is a very broad field with many named patterns (such as Hammer, Engulfing, Morning Star, etc.).
For beginners, there is no need to rush to memorize all patterns.
First, learn to understand the structure of a single K-Line itself (OHLC) and the "story" it conveys about the relationship between open, close, high, and low prices.
5. Why Use K-Line Charts?
Compared to simple line charts or other chart types, K-Line charts are so popular because:- Rich Information: One K-Line contains four key price points, providing a more comprehensive market snapshot than line charts (which usually only show closing prices).
- Intuitive Visuals: The color and length of the real body, and the length of the shadows, visually display the price volatility range and direction for each time period, as well as the contrast between bullish and bearish forces.
- Easy Pattern Recognition: Combinations of K-Lines more easily form recognizable and statistically significant chart patterns, which are the foundation of technical analysis and price action trading.
6. Advice for Beginners
- Master the Basics: The most important step is to be able to proficiently identify the open, high, low, and close prices of any K-Line, understand the composition of the real body and shadows, and grasp the basic meaning of colors.
- Observe Different Time Periods: Look at K-Line charts on daily, 4-hour, 1-hour, and other timeframes. You will find that different periods tell different "stories".
- Start with Simple Patterns: Learn to recognize the most basic patterns, such as long real bodies (indicating strength), long shadows (indicating hesitation or reversal pressure), or Doji (indicating balance/hesitation), and think about what market implications they might suggest.
- Combine with Market Context: Never view a single K-Line pattern in isolation! The reliability of a K-Line pattern largely depends on the market context in which it appears (e.g., in an uptrend or downtrend? Near key support/resistance levels or random locations?). It is best to combine trend, key levels, or other analysis tools for comprehensive judgment.
- Practice is Key: Reading K-Line charts is a skill that requires extensive observation and practice. Spend time watching charts on a Demo Account to see how K-Lines form and how prices develop afterward.
Conclusion
The K-Line Chart (Candlestick Chart) is the most fundamental and important tool for forex traders to observe the market and conduct technical analysis.Each K-Line contains the four key pieces of information: open, high, low, and close prices (OHLC), and vividly displays the balance of buying and selling forces and price fluctuations during a specific time period through different combinations of real bodies, shadows, and colors.
Learning to read a single K-Line is the foundation, then understanding the patterns formed by combinations of K-Lines and interpreting them within the overall market trend and key level context is key to using K-Line charts for trading decisions.
For beginners, solidly mastering the basics of K-Line charts and cultivating the ability to "read charts" through extensive practice will lay a strong foundation for learning more advanced technical analysis and trading strategies.