Introduction to Forex Chart Patterns: Identifying Head and Shoulders, Double Tops/Bottoms, and Triangle Trading Signals
When you stare at Forex candlestick charts for a long time, you may gradually notice that price fluctuations are not entirely random; sometimes they form recognizable "shapes" or "structures."These specific shapes outlined by price movements over a period are what technical analysts call "chart patterns".
It is believed that the appearance of these patterns often reflects the battle of forces and psychological changes between market participants (buyers and sellers), and may indicate whether the price will continue the current trend or reverse.
Learning to identify these patterns is like learning to read the signals the market sends through charts.
This article will introduce you to the basic concepts of chart patterns and use several of the most common and classic patterns as examples, such as head and shoulders, double tops/bottoms, and triangles, to help you initially understand how to find potential trading clues from charts.
1. What Are Chart Patterns? Graphical Expressions of Market Psychology
Chart patterns refer to specific geometric shapes formed on price charts by connecting a series of price highs and lows with lines, which have distinct recognizability.Technical analysts study these patterns because they believe that based on the principle that "history often repeats itself," certain specific patterns repeatedly appear in history and are often accompanied by particular subsequent price movements (such as trend continuation or reversal).
These patterns can be seen as a visual representation of collective market psychology (e.g., buyer confidence, seller fear, hesitation between bulls and bears) on the chart.
By identifying them, traders attempt to judge the current balance of market forces and predict the most likely future price direction.
2. Two Major Categories of Chart Patterns
Although there are many types of chart patterns, based on their usual market implications, they can be roughly divided into two categories:- Reversal Patterns: These patterns usually indicate that the current trend (whether upward or downward) may be coming to an end, and the market direction might reverse.
- Continuation Patterns: These patterns usually suggest that the current trend is only temporarily pausing or consolidating and is likely to continue moving in the original direction afterward.
The examples we will introduce next include both types of patterns.
3. Examples of Common Chart Patterns
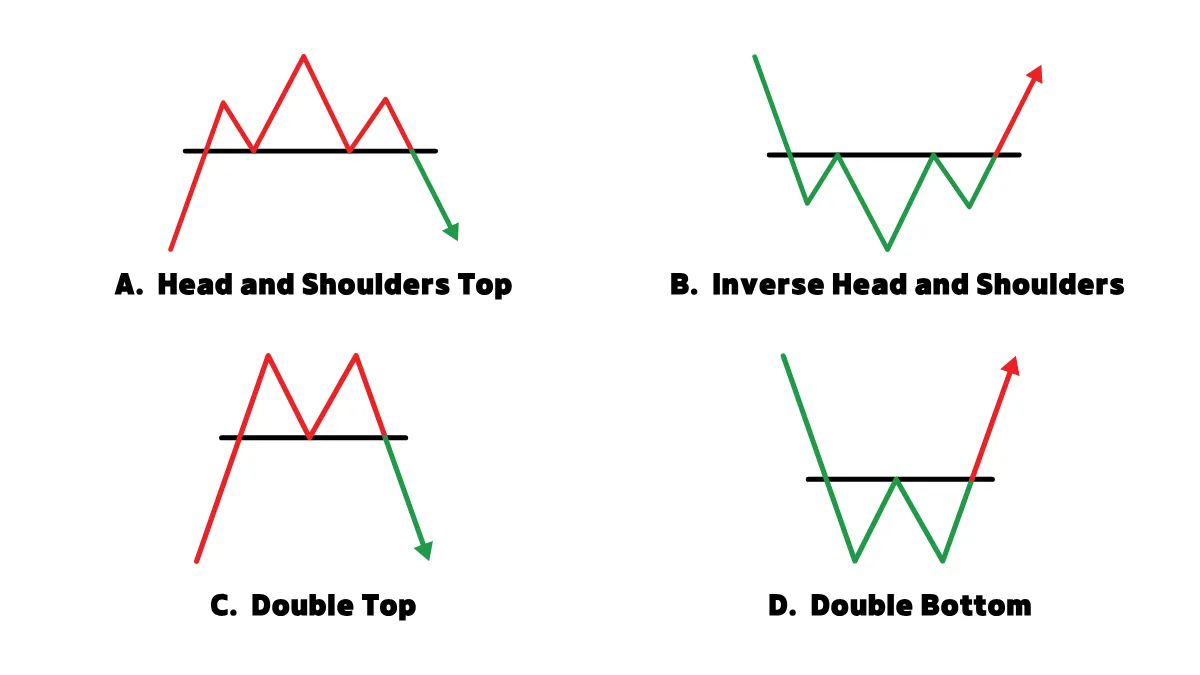
Examples of Reversal Patterns:- A. Head and Shoulders Top:
- Shape: Resembles a person's head and two shoulders. The price first rises to form a peak (left shoulder), then falls back, rises again to create a higher peak (head), falls back again, and rebounds once more but fails to reach the height of the head (right shoulder), then finally declines. The line connecting the two low points of the declines is called the "Neckline."
- Meaning: Usually appears at the end of an uptrend and is considered a strong bearish reversal signal. When the price decisively breaks below the neckline, the pattern is considered complete, indicating a possible start of a downtrend.
- B. Inverse Head and Shoulders:
- Shape: The inverse of the head and shoulders top pattern, appearing in a downtrend. The pattern looks like an upside-down human figure.
- Meaning: Usually appears at the end of a downtrend and is considered a strong bullish reversal signal. When the price decisively breaks above the neckline, the pattern is complete, indicating a possible start of an uptrend.
- C. Double Top:
- Shape: The price rises twice to nearly the same high point (forming an "M" shape) but fails to break through the resistance level both times, then falls.
- Meaning: Usually appears after an uptrend, indicating exhaustion of upward momentum and is a potential bearish reversal signal. The pattern is confirmed when the price breaks down below the low point between the two highs (support level).
- D. Double Bottom:
- Shape: The price falls twice to nearly the same low point (forming a "W" shape) but fails to break below the support level both times, then rises.
- Meaning: Usually appears after a downtrend, indicating exhaustion of downward momentum and is a potential bullish reversal signal. The pattern is confirmed when the price breaks above the high point between the two lows (resistance level).
Examples of Continuation/Neutral Patterns:
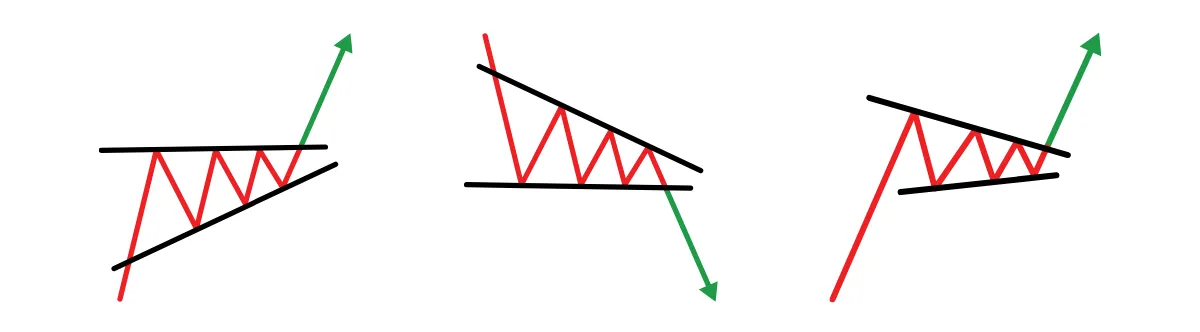
- E. Triangles:
- Shape: Price volatility gradually narrows, constrained by two converging trendlines (one connecting highs, one connecting lows), forming a triangle shape. Based on the slope of the trendlines, triangles can be classified as ascending, descending, or symmetrical.
- Meaning: Triangles are usually considered temporary consolidation or hesitation phases in the market. They can act as continuation patterns (where price eventually breaks out in the direction of the trend before entering the triangle) or reversals. Therefore, traders usually wait for a clear breakout above or below the triangle boundary before deciding the trading direction.
4. How to Use Chart Patterns? The Key Is Confirmation
Identifying potential chart patterns is only the first step; more importantly, how to use them:- Patiently wait for the pattern to complete: Do not rush to enter a trade just because a pattern seems to be forming. Most patterns require a "confirmation signal" to be considered valid.
- Focus on the "breakout": This confirmation signal is usually a decisive price breakout of the pattern’s key boundary line (e.g., neckline of head and shoulders, support/resistance of double tops/bottoms, trendlines of triangles). This is closely related to the "breakout strategy" we discussed earlier. Trading based on the pattern is standard only after the breakout occurs and in the breakout direction.
- Set reasonable stop-loss and targets: Any pattern can fail (resulting in false breakouts or invalid patterns). Therefore, pattern-based trading must set stop-loss orders (e.g., placed opposite to the breakout point or beyond a key point within the pattern). Some patterns also provide methods to estimate potential price targets (e.g., based on the pattern’s height), which can be used as references for setting take-profit levels.
5. Notes on Chart Patterns
- Patterns can fail: To reiterate, chart patterns are based on historical probabilities and are not 100% accurate predictions. Any pattern can fail.
- Identification involves subjectivity: In real market charts, patterns are often not perfect or standard. How to draw the neckline? Does this count as a valid double top? Different people may have different judgments. This requires extensive practice to develop consistent identification skills.
- Combine with market context: A single pattern appearing alone may be less reliable than one appearing near key support/resistance levels or aligned with the main trend direction. Combining pattern analysis with other tools (such as trend judgment and indicator confirmation) usually yields better results.
6. Are Chart Patterns Suitable for Beginners?
Learning value: Learning to identify basic and common chart patterns is very helpful for beginners to understand market structure and develop chart intuition. It is an important part of technical analysis learning.Challenges for beginners: Accurately identifying patterns in real-time changing charts, distinguishing valid patterns from noise, and handling pattern failures (false breakouts) are quite difficult for beginners and require time and experience to accumulate.
Subjectivity may also confuse beginners.
Recommendations:
- Beginners should start by learning to identify the most common and clearest patterns (e.g., double tops/bottoms, simple triangles).
- It is recommended to practice identification on longer timeframes (such as Daily chart D1, 4-hour chart H4) because patterns on longer timeframes are usually more reliable and have less noise.
- Prioritize focusing on continuation patterns that align with the main trend direction or reversal patterns appearing at very critical historical support/resistance levels. Avoid searching for unclear patterns in chaotic markets.
- Most importantly: Always wait for the pattern’s confirmation signal (breakout) before taking action, and strictly apply risk management (stop-loss and position sizing).
- Extensive practice on a Demo Account is the best way to improve pattern recognition skills and verify related trading ideas.
Conclusion
Chart patterns are a method in technical analysis that predicts future directions by observing specific shapes formed by price movements.Common examples include head and shoulders, double tops/bottoms, and triangles, which may indicate trend reversals or continuations.
Understanding the market psychology behind these patterns and their typical meanings is valuable for traders.
However, patterns are not foolproof, and identification involves some subjectivity.
For beginners, learning to recognize basic patterns is an important lesson, but more crucial is learning to patiently wait for pattern confirmation (usually a breakout of key levels) and always consider the overall market context, combined with strict risk management when trading.