Introduction to Forex Fibonacci Tools: The Magical Numbers for Finding Potential Retracements and Target Levels?
When you browse forex charts or read market analysis, you may often encounter horizontal lines marked with specific percentages (such as 38.21%, 50%, 61.81%). These are drawn using the “Fibonacci” tool.The Fibonacci tool is a method commonly used by technical analysts to predict where the price might retrace to within a trend (Retracement), and where the price might move to as a target after a breakout (Extension).
Its name comes from a sequence discovered by the medieval Italian mathematician Fibonacci. This sequence and its derived ratios (especially the “Gold Ratio”) are widely found in nature.
Some traders believe these ratios also have significance in financial markets, possibly reflecting collective market psychology or natural rhythms.
Sounds a bit magical, doesn’t it?
This article will briefly introduce the basic concepts of the Fibonacci tool, the usage of its two main types, and the key points and limitations to be aware of when using them.
1. Fibonacci Sequence and the Gold Ratio (Background Knowledge, Brief Introduction)
The Fibonacci sequence is a very simple sequence: 0, 1, 1, 2, 3, 5, 8, 13, 21, 34...Each number (starting from the third) is the sum of the previous two.
Interestingly, as the sequence progresses, the ratio between adjacent numbers approaches an irrational number, approximately 0.618, which is the famous “Gold Ratio”.
Its reciprocal is about 1.618, and other ratios between adjacent numbers also approximate specific values such as 0.382 (≈ 1 - 0.618), etc.
The Fibonacci levels commonly used in trading are based on these ratios, especially 38.21% (0.382), 61.81% (0.618), and although not strictly a Fibonacci ratio but widely used, 50% (0.5).
Key point: You don’t need to delve deeply into the mathematical principles.
Modern trading platforms have built-in Fibonacci tools; you just need to learn how to correctly draw and apply them on charts. The platform will automatically calculate and mark these key percentage levels.
2. Fibonacci Retracement: Finding Potential Support/Resistance within a Trend
- Purpose: This is the most commonly used Fibonacci tool. Its main purpose is to predict, within an already formed trend (uptrend or downtrend), where the price might find support or resistance during a temporary retracement (a correction against the main trend direction), and possibly resume the original trend.
- How to draw:
- In a clear uptrend: Find the start of the trend (an important swing low, marked as point A), then drag the tool to the end of the trend (an important swing high, marked as point B).
- In a clear downtrend: Find the start of the trend (an important swing high, marked as point C), then drag the tool to the end of the trend (an important swing low, marked as point D).
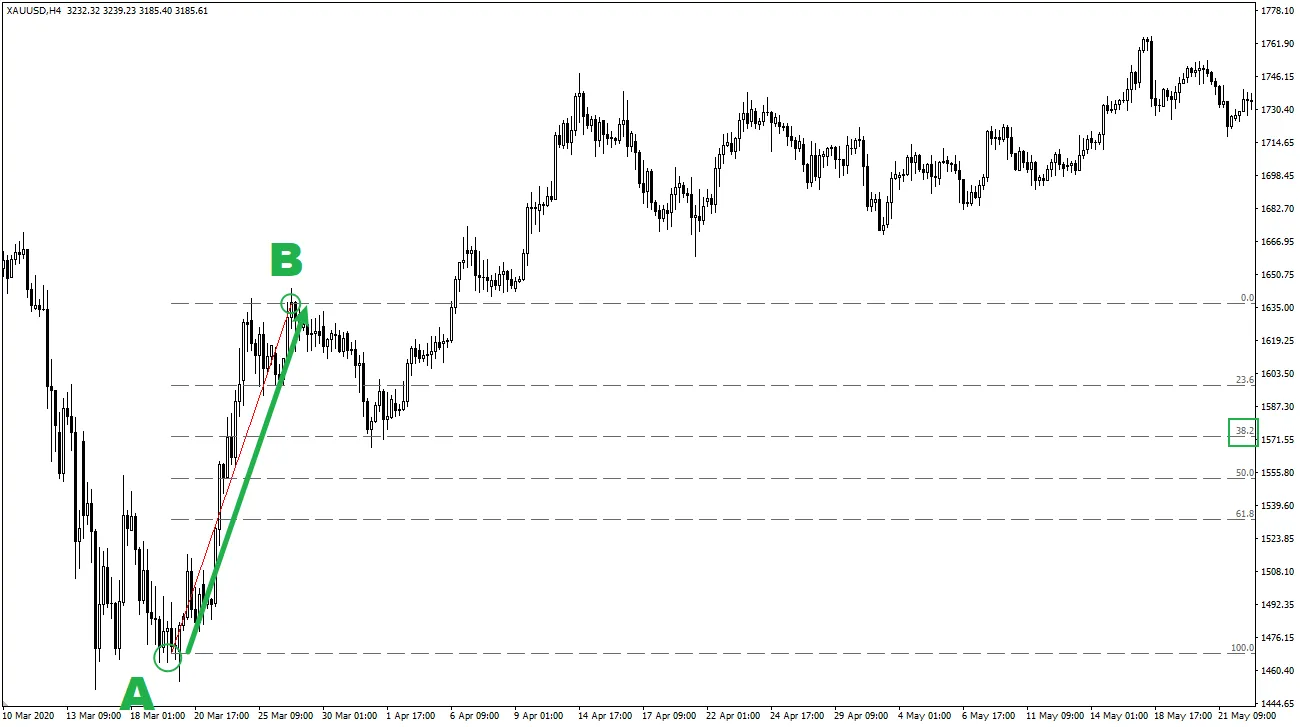
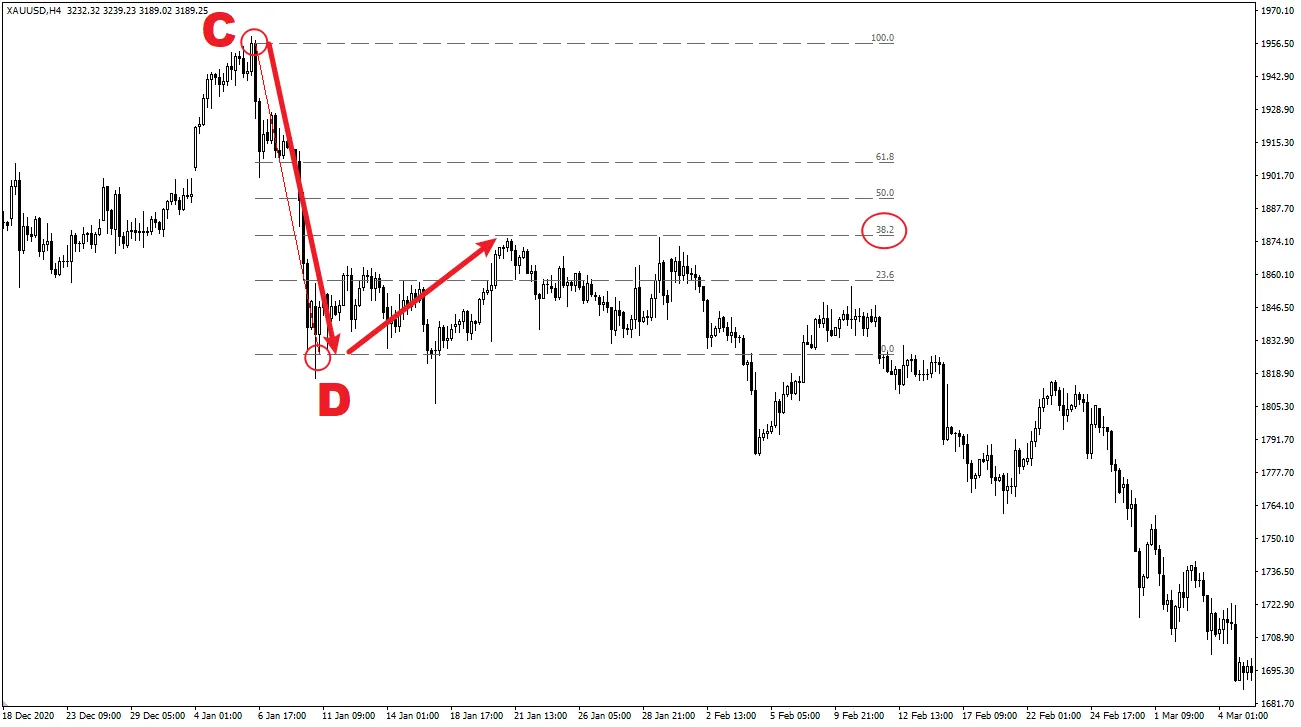
- Key retracement levels: After drawing, the platform will automatically mark several key Fibonacci percentage levels along the vertical distance between points A and B. The most watched levels usually are:
- 38.21%
- 50% (an important psychological midpoint retracement)
- 61.81% (considered the “Gold retracement level”)
- How to apply: Traders observe whether the price stops or slows near these Fibonacci levels during the retracement.
- In an uptrend retracement, these levels may act as potential support. If bullish candlestick reversal patterns appear near a retracement level (such as 50% or 61.81%), trend followers may consider buying.
- In a downtrend rebound, these levels may act as potential resistance. If bearish candlestick reversal patterns appear near a retracement level, trend followers may consider selling.
3. Fibonacci Extension: Predicting Potential Price Target Levels
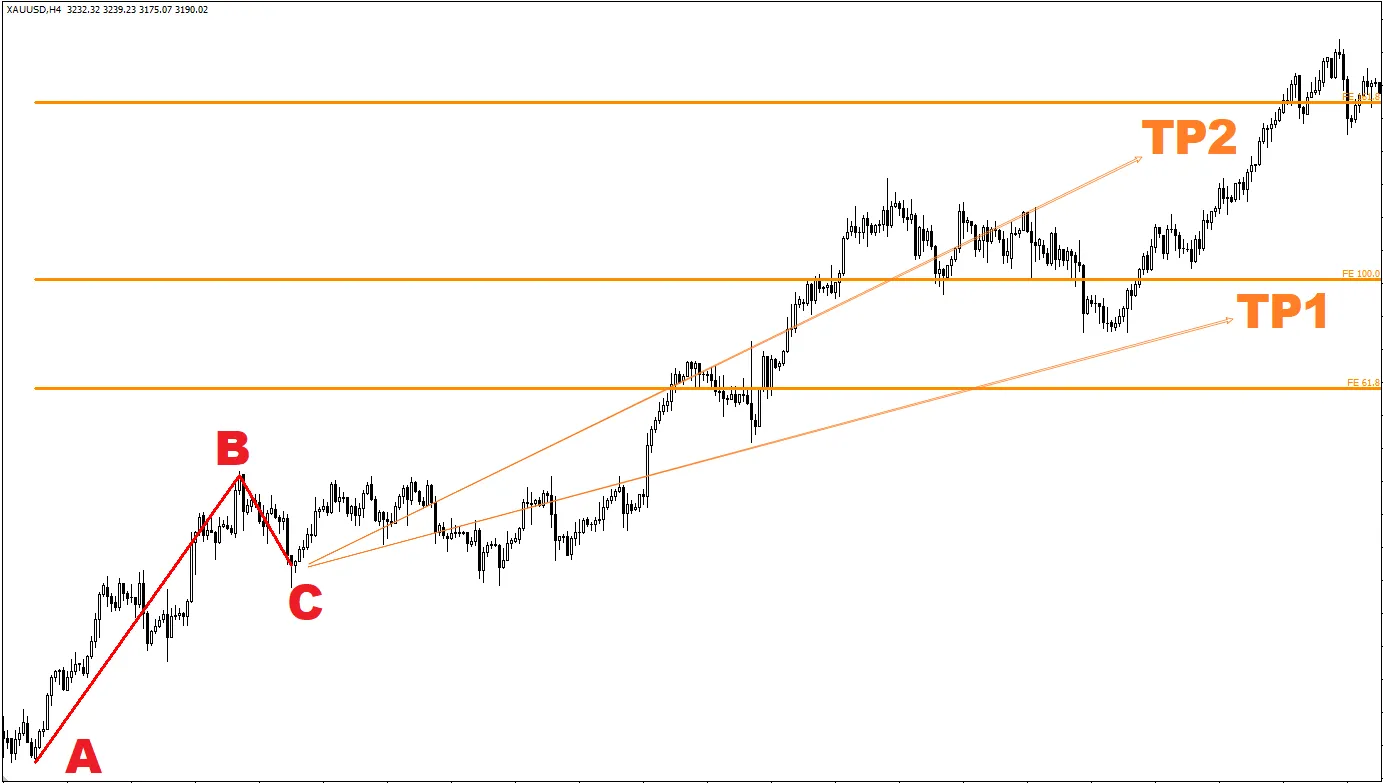
- Purpose: Unlike the retracement tool which finds support and resistance within a trend, the extension tool is mainly used to predict where the next wave of price movement might extend to after a major price move (A to B) and its subsequent retracement (B to C) are completed.
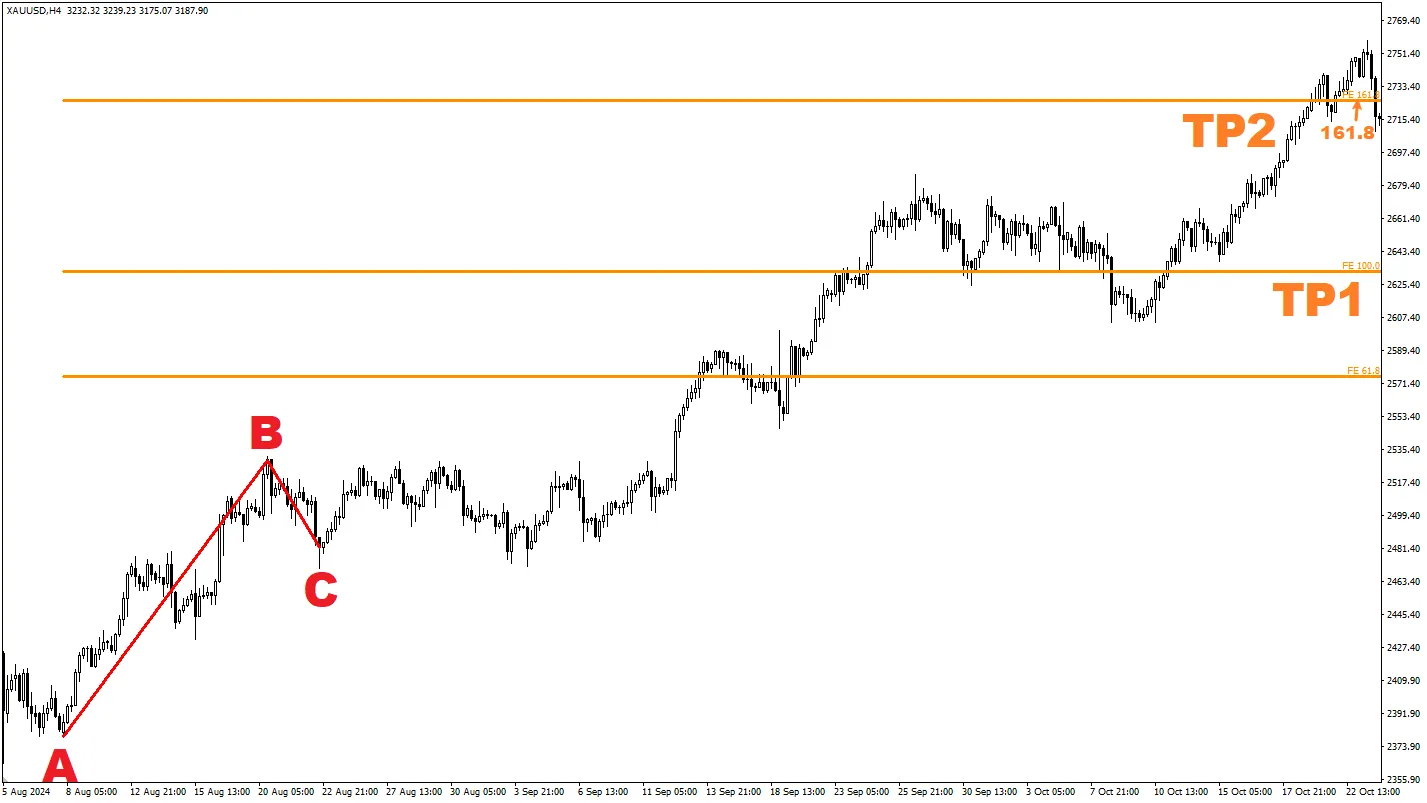
- How to draw (common three-point method): Usually requires selecting three points:
- The start of the initial trend (point A, e.g., Swing Low).
- The end of the initial trend (point B, e.g., Swing High).
- The end of the subsequent retracement (point C, e.g., Retracement Low).
- Key extension levels: The tool projects potential target levels outward from point C based on the distance from A to B. Common extension levels include:
- 100% (indicating the next wave from point C may equal the A to B move)
- 161.81% (an important “Gold extension level”)
- How to apply: Extension levels are mainly used to set potential Take-Profit Levels. For example, if you enter a long position near point C based on retracement completion signals, you might set the 100% or 161.81% extension levels as your first or second exit targets.
4. Notes and Limitations of Fibonacci Tools
- Subjectivity issue: How to select the “important” swing highs and lows (points A, B, C) to draw Fibonacci tools is quite subjective. Different traders choosing different start and end points will produce different horizontal levels. This is one of the biggest challenges when using Fibonacci tools.
- Not precise “magic lines”: Prices do not always stop exactly at Fibonacci levels. They should be viewed more as potential “zones” or “areas” of interest rather than absolute points. Prices can easily break through a level or reverse between two levels.
- Must seek confirmation signals: Never blindly enter a trade just because the price reached a Fibonacci level! You must look for other technical signals for confirmation:
- Price action signals: Are there clear reversal candlestick patterns near the retracement level?
- Confluence with other technical elements: Is the Fibonacci level also an important previous high/low, trendline, or moving average? Multiple technical reasons pointing to the same price area increase its significance.
- Indicator signals: When price touches a Fibonacci level, do indicators like RSI or MACD also give corresponding signals (e.g., oversold, divergence) ?
- Can cause chart clutter: Drawing too many Fibonacci lines from different swings on the chart can make it very messy and hard to interpret.
5. Are Fibonacci Tools Suitable for Beginners?
- Learning value: Understanding the concepts of retracement and extension helps in grasping the wave-like movements of the market. Fibonacci tools are readily available on almost all trading platforms.
- Challenges for beginners: The subjectivity in drawing, the need for additional confirmation signals, and the tendency to mistakenly treat them as “precise prediction tools” all pose challenges for beginners.
Recommendations:
- Beginners can start by learning to use the “Fibonacci Retracement” tool, as it directly relates to finding potential support and resistance within trends, which is a core concept of technical analysis.
- Practice drawing retracement lines on clear trends in a Demo Account, trying to identify obvious swing highs and lows.
- Focus on observation rather than immediate trading: Observe how price reacts when it reaches key retracement levels (especially 38.21%, 50%, 61.81%). Does it hesitate? Does a reversal candlestick appear? Or does it break through directly?
- Look for “confluence” zones: Pay special attention to Fibonacci retracement levels that coincide with other important technical levels (such as previous highs/lows, trendlines, moving averages). These “confluence zones” are usually more significant.
- Understand Fibonacci extension levels as possible target references, not precise endpoints.
- Always combine with risk management: Even when entering trades at seemingly perfect Fibonacci levels with confirmation signals, always set stop-loss orders.
Conclusion
The Fibonacci tool (mainly retracement and extension) uses specific percentages derived from the Fibonacci sequence to help traders identify potential retracement support/resistance levels within trends (Retracement tool), and predict possible target zones the price may reach (Extension tool).Although popular among traders, it is important to recognize that their drawing is subjective, the marked levels are potential reference zones rather than precise points, and they absolutely require confirmation from other technical signals before considering them for trading.
For beginners, learning to use the Fibonacci retracement tool to assist in judging support and resistance within trends is beneficial, but it must be used cautiously, focusing on observation, seeking confluence, and treating it as part of an analysis toolbox rather than the sole reliance.