Forex Technical Indicators: Introduction to the MACD Indicator - A Powerful Tool for Capturing Trends and Momentum?
After learning about Moving Averages (MA) and the Relative Strength Index (RSI), you might wonder if there are other commonly used technical indicators.The answer is yes, and the MACD indicator is one of the most popular tools you can find on almost all forex margin trading platforms (such as MT4, MT5).
MACD is an indicator that can both follow trends and measure momentum. Its name, "Moving Average Convergence Divergence," hints at its working principle—observing the relationship between two moving averages of different speeds.
On trading platforms, it may look a bit more complex than previous indicators, but once you understand the meaning of each component and how they are displayed on your platform, it can provide powerful assistance in market analysis.
This article will briefly introduce the components of MACD, common trading signals and their limitations, and specifically explain its common display on platforms like MT4/MT5.
1. What is the MACD Indicator?
The MACD indicator was invented by technical analyst Gerald Appel. It is a trend-following momentum oscillator.Its main purpose is to show changes in an asset's price momentum (i.e., the speed and strength of price changes) and potential trend direction.
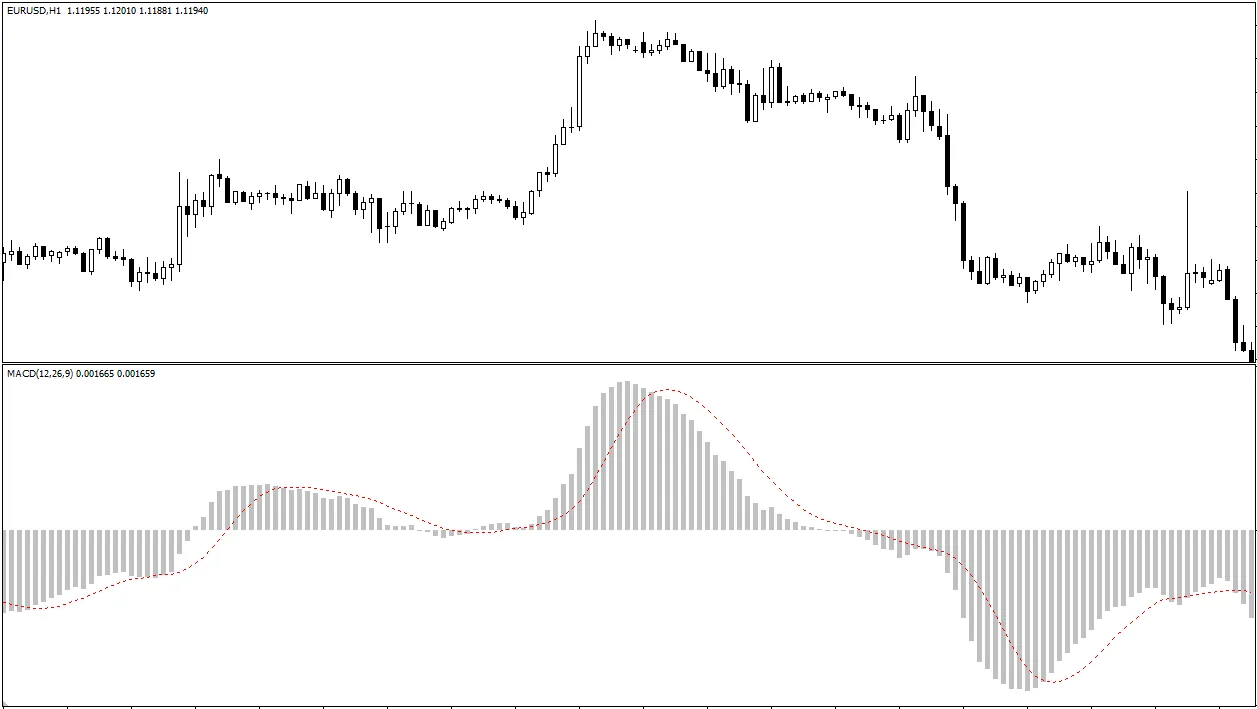
MACD is usually plotted in a separate window below the main price chart.
2. Main Components of MACD (Using MT4/MT5 Platforms as an Example)
When you load the standard MACD indicator on MT4 or MT5 platforms, you typically see the following visual elements. It is important to understand their relationship with the core MACD calculations:- MACD Value
This is the foundation of the MACD indicator. It is calculated by subtracting a long-term Exponential Moving Average (EMA) (usually 26 periods by default) from a short-term EMA (usually 12 periods by default) on the trading platform.
The resulting difference is called the "MACD value." It reflects changes in short-term price momentum relative to long-term price momentum. - Signal Line:
This is the element you most easily recognize as "a line" in the MACD indicator window, usually displayed as a red line by default.
It is calculated as the EMA of the "MACD value" itself (usually 9 periods by default).
Because it is a smoothed version of the "MACD value," it lags behind changes in the "MACD value." Its main function is to work with the "MACD value" (and its visual representation) to generate trading signals (such as crossovers). - Histogram
This is a bar chart oscillating above and below a zero line.
In the standard MACD indicator on MT4/MT5, the histogram intuitively shows the distance (difference) between the "MACD value" and the "signal line." That is: Histogram height = MACD value - Signal line value.
- Histogram above zero line: Indicates the "MACD value" is greater than the "signal line value" (i.e., the MACD line is above the signal line if both are plotted as lines). This usually means bullish momentum may be strengthening or sustaining. The taller the bars, the greater the difference, indicating stronger short-term momentum.
- Histogram below zero line: Indicates the "MACD value" is less than the "signal line value" (i.e., the MACD line is below the signal line). This usually means bearish momentum may be strengthening or sustaining. The longer the bars (downward), the greater the difference, indicating stronger short-term momentum.
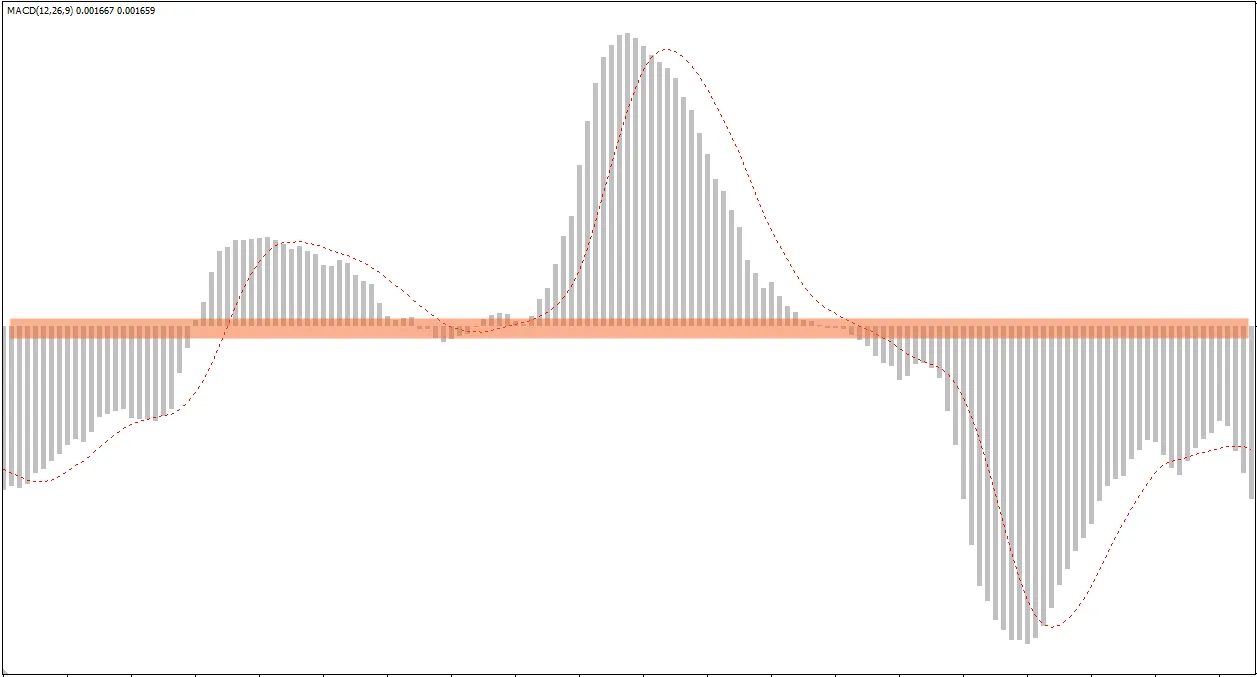
- Histogram contracting toward zero line: Indicates the "MACD value" and "signal line" are converging, suggesting that the current directional momentum may be weakening.
Summary of Common MT4/MT5 Display: What you usually see on the platform are the **histogram** representing the difference and a **signal line**. The textbook "MACD line" behavior often requires you to indirectly judge by observing the histogram's position and shape relative to the zero line and its relationship with the signal line.
3. Common MACD Trading Signals
Traders usually focus on the following MACD signals, which are judged based on the relationship between the "MACD value" (interpreted via histogram or actual lines), the "signal line," and the "zero line":- "MACD value" and Signal Line Crossovers:
- Bullish Crossover (Golden Cross): When the "MACD value" crosses above the "signal line" from below (on MT4/MT5 charts, this may appear as the histogram shortening from negative territory toward the zero line and then growing in positive territory, with the signal line being crossed by the histogram's implied trajectory; or if MACD values are also shown as lines, the fast line (MACD line) crosses above the slow line (signal line) ). This is usually seen as a potential buy signal, indicating strengthening short-term bullish momentum.
- Bearish Crossover (Death Cross): When the "MACD value" crosses below the "signal line" from above (the histogram and signal line behavior is the opposite of the Golden Cross). This is usually seen as a potential sell signal, indicating strengthening short-term bearish momentum.
- Zero Line Crossovers:
- "MACD value" crossing above zero line: (On MT4/MT5 charts, the histogram moves from below zero to above zero) indicates the short-term EMA has risen above the long-term EMA, and the overall market momentum may be turning positive/bullish.
- "MACD value" crossing below zero line: (Histogram moves from above zero to below zero) indicates the short-term EMA has fallen below the long-term EMA, and the overall market momentum may be turning negative/bearish. Zero line crossovers are usually seen as a stronger, more medium-term trend or momentum shift signal, but their lag is also more pronounced.
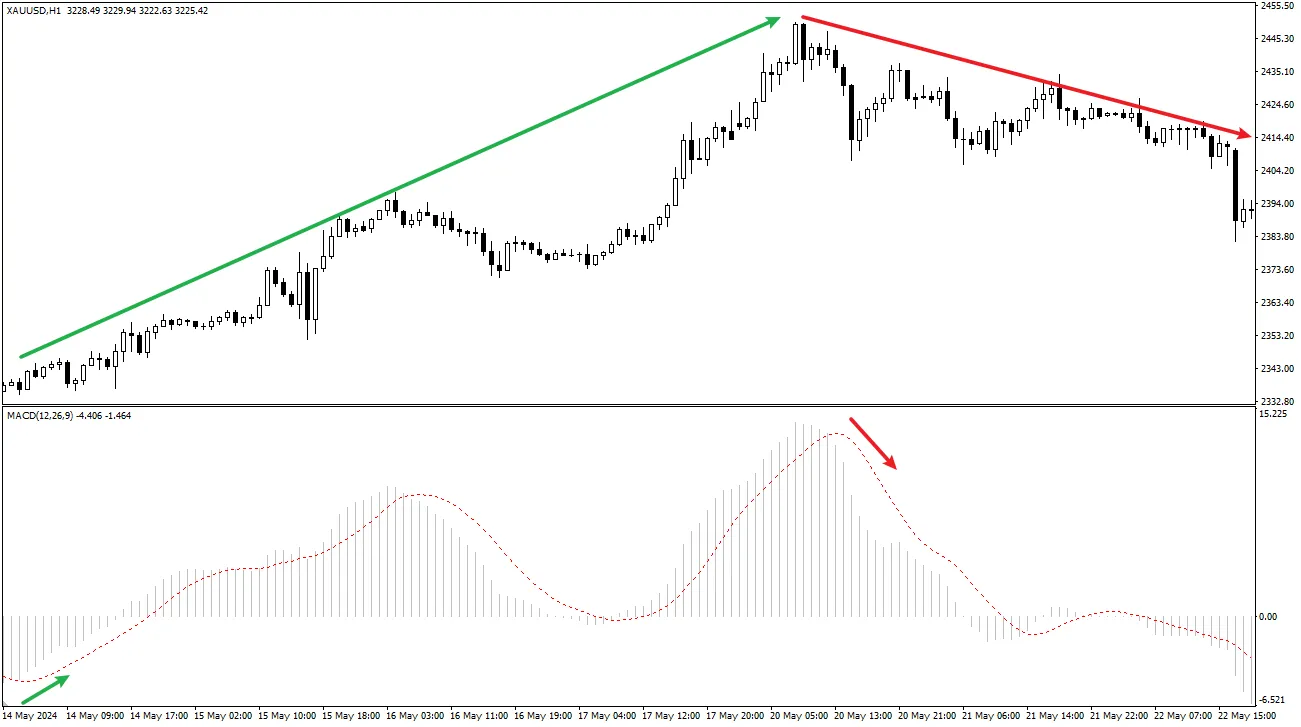
- Divergence:
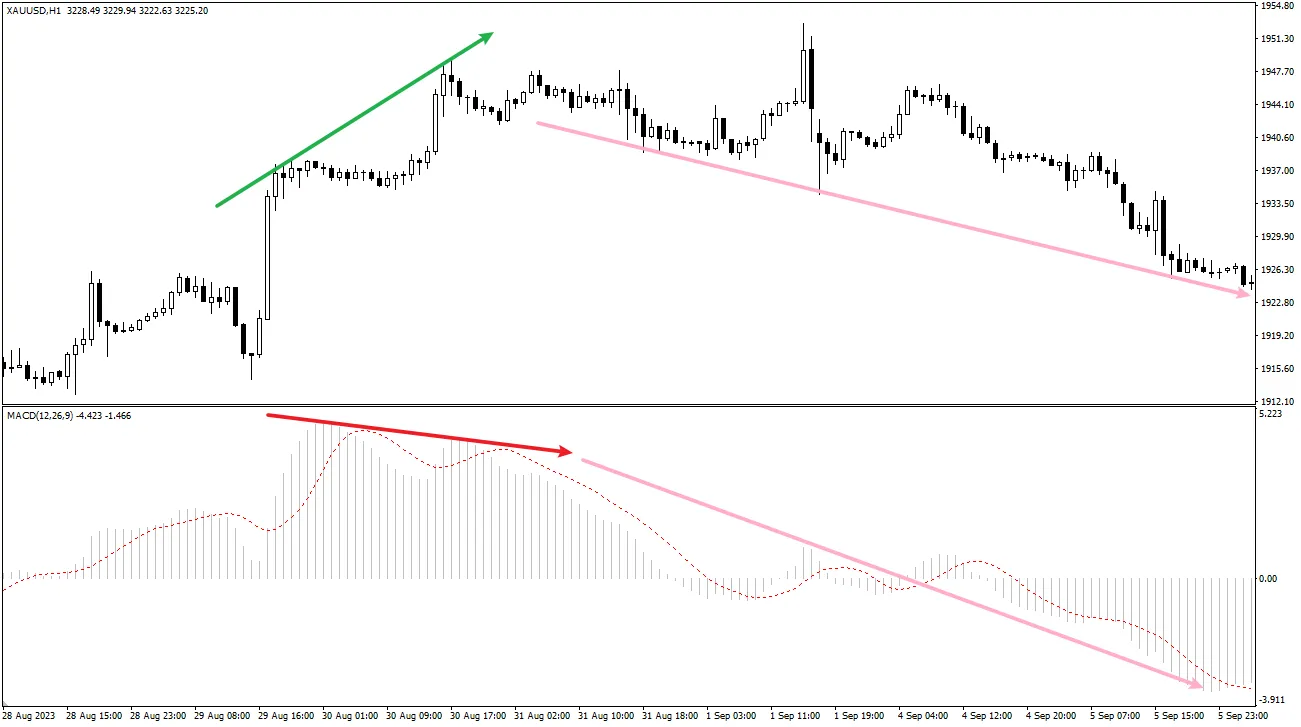
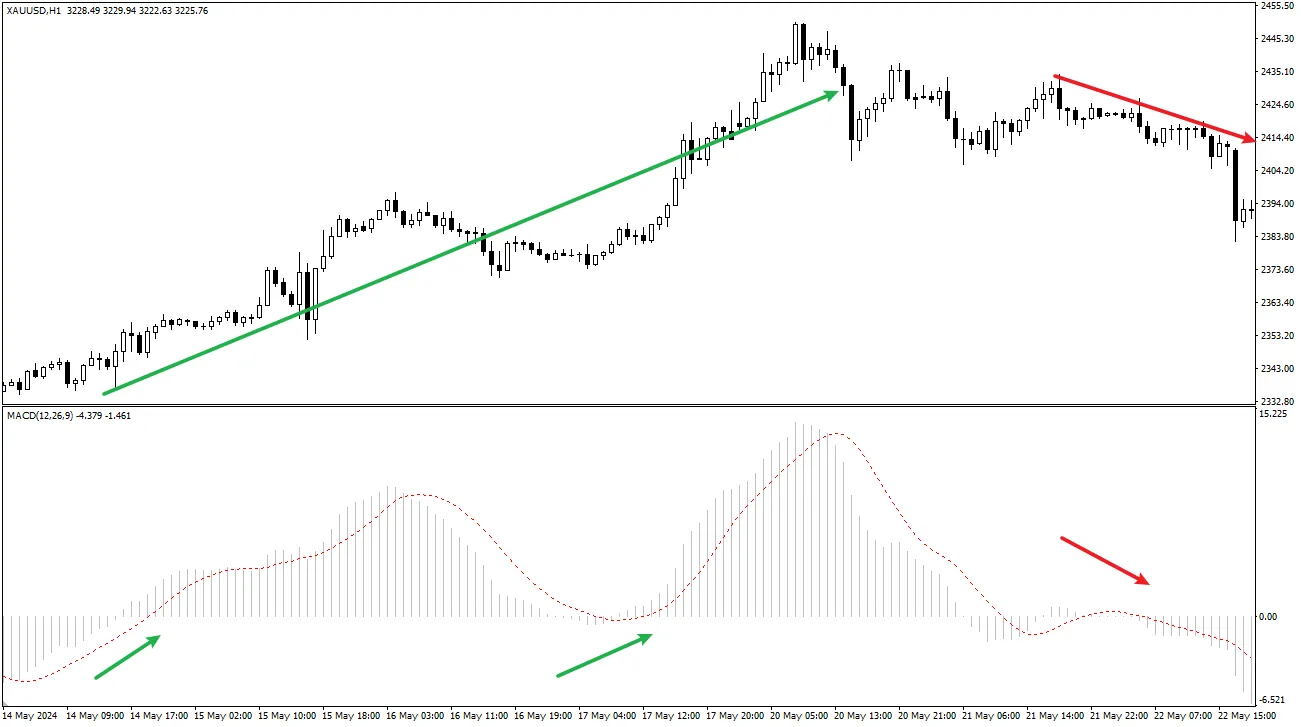
- Bearish Divergence: Price makes a new high, but the "MACD value" (observed via histogram peaks or actual MACD line peaks) fails to make a corresponding new high. This suggests weakening upward momentum and may signal a potential downward reversal.
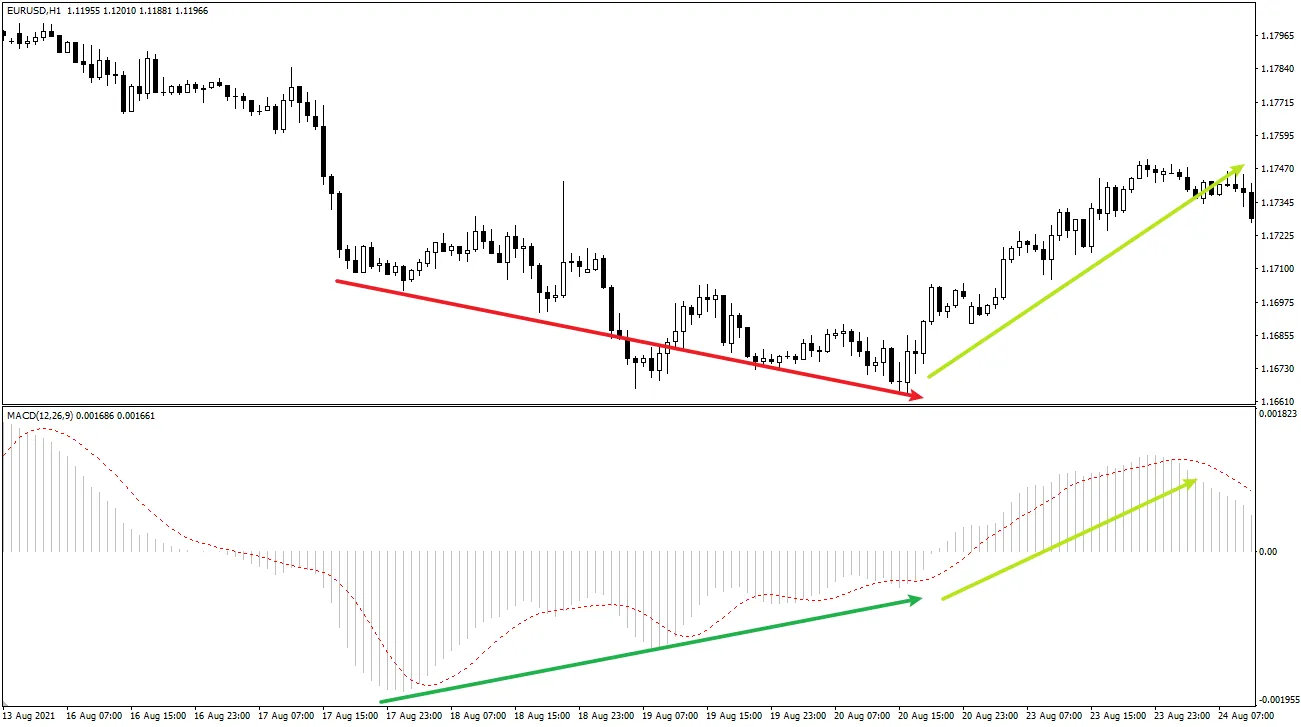
- Bullish Divergence: Price makes a new low, but the "MACD value" (observed via histogram troughs or actual MACD line troughs) fails to make a corresponding new low. This suggests weakening downward momentum and may signal a potential upward reversal.
- Note: Divergence is a warning signal indicating possible trend exhaustion, but it is not a precise reversal point prediction. Confirmation from price action is necessary before taking action.
4. Limitations of MACD
When using the MACD indicator, it is important to understand its shortcomings:- Lagging Nature: Because MACD is based on moving averages, it inherently has lag. Signals like crossovers always appear after the actual price changes.
- Poor Performance in Sideways Markets: In range-bound or choppy markets without clear trends, MACD components frequently entangle and cross near the zero line, producing many unreliable trading signals.
- False Signals: No indicator is perfect, and MACD is no exception. Learning to filter and confirm signals is necessary.
5. Is MACD Suitable for Beginners?
- Relatively Intuitive Visual Elements: The interaction between the MACD histogram and signal line, and their relationship with the zero line, are relatively easy for beginners to observe and understand visually.
- Widely Used: Learning to use MACD helps in understanding market analysis articles and communicating with other traders.
- Requires Correct Understanding of Platform Display and Concepts: Beginners need to spend time understanding how the visual elements of MACD on their platform (especially the histogram) correspond to the textbook concepts of the "MACD line" and "signal line" to avoid confusion. The biggest risk is oversimplifying by relying solely on crossover signals while ignoring the overall market trend context and the indicator's lag.
Recommendations:
- MACD is a highly worthwhile technical indicator for beginners to learn.
- First Understand Platform Display: Clarify what the MACD histogram represents on your commonly used trading platform (such as MT4/MT5) — usually MACD value minus signal line value — and what the lines represent (usually the signal line).
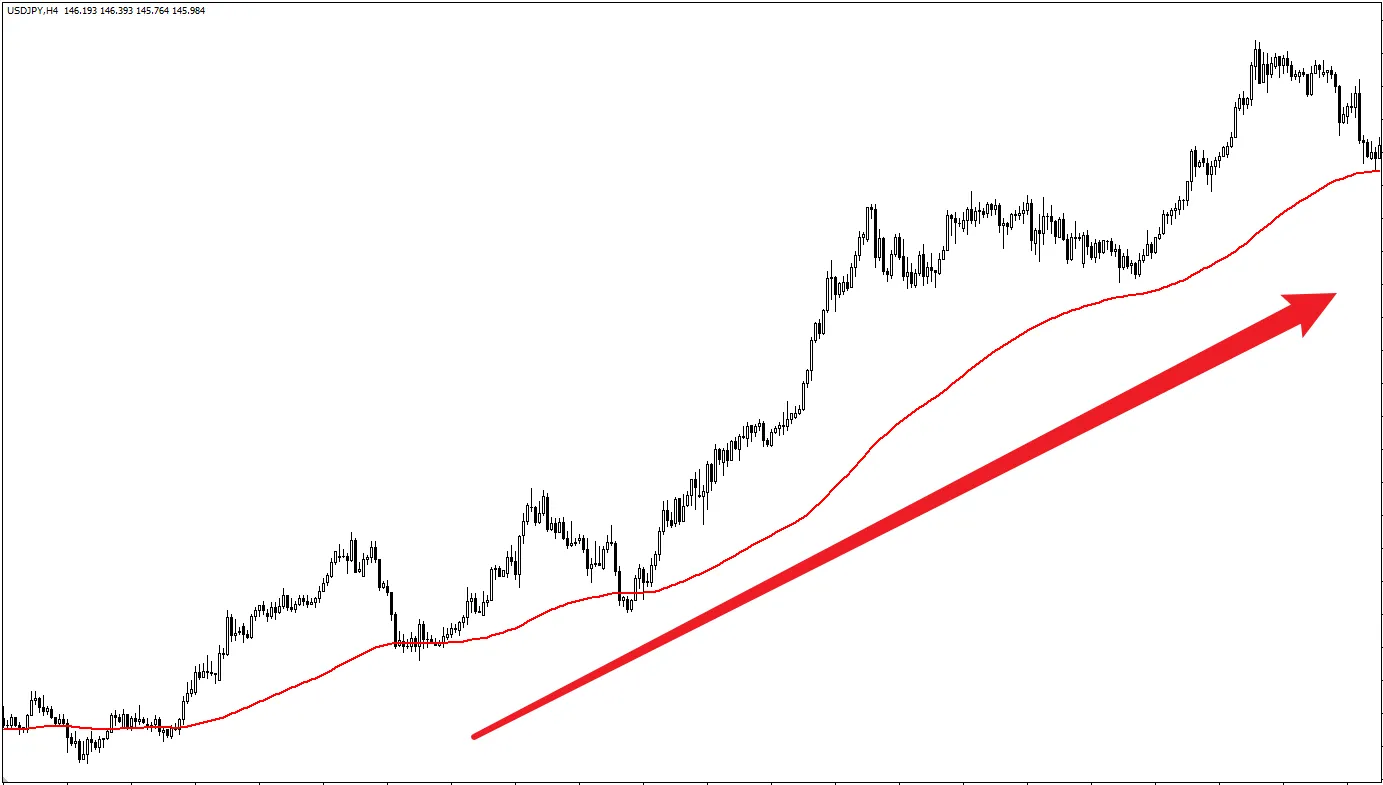
- Use in Combination with Trend: Interpret MACD signals within the context of the main trend. For example, in a confirmed uptrend, pay more attention to bullish crossovers or strong histogram performance above the zero line.
- Observe Histogram Changes: Changes in histogram length, such as shortening or moving from negative to positive (or vice versa), can provide additional visual clues about momentum changes.
- Be Cautious with Divergence: Treat divergence as a warning signal that requires price action confirmation rather than a direct trading instruction.
- Multiple Confirmation Principle: Never rely solely on any single MACD signal. Combine it with price action analysis (support and resistance, trendlines, candlestick patterns) or other indicators to seek multiple confirmations.
- Simulation Practice is Essential: Practice repeatedly on a Demo Account, observe MACD performance in different market environments, and find a usage style that suits you.
Conclusion
MACD is a powerful trend-following momentum indicator. On platforms like MT4/MT5, it usually displays market momentum changes and potential trend directions through the interaction of a visual histogram and a signal line.Its most common uses include line crossovers (conceptually between MACD value and signal line), zero line crossovers, and divergence analysis.
Although MACD is not perfect due to its lag and limitations in ranging markets, if you correctly understand its principles and how it is displayed on trading platforms, interpret its signals within the appropriate market context, and combine it with other analytical tools for confirmation, it remains a very effective auxiliary tool for beginners learning technical analysis and capturing trading opportunities.
Remember, any indicator should serve your trading decisions and always be used with strict risk management.