Introduction to Forex Technical Indicators: The Mystery of Moving Averages (MA) - SMA vs. EMA
When you see one or more smooth curves following price movements on a forex chart besides the candlesticks, it is very likely a "Moving Average" (MA).It is one of the most widely used indicators in technical analysis and a cornerstone of many trading strategies.
The main function of moving averages is like applying a "filter" to price fluctuations, helping us filter out short-term market noise and see the main trend direction of the price more clearly.
Understanding what moving averages are and the differences between the two most common types — Simple Moving Average (SMA) and Exponential Moving Average (EMA) — is an important step in learning technical analysis.
This article will provide you with a simple and easy-to-understand introduction to the basic concepts, main types, common uses, and limitations of moving averages.
1. What is a Moving Average (MA) ? The "Average Trajectory" of Price
A Moving Average, as the name suggests, calculates the average price over a specific past period and connects these average values to draw a line on the chart.This "specific period" is the "Period" of the moving average. For example, a 20-day moving average calculates the average closing price of the past 20 trading days.
Core Function: By calculating the average, it smooths out the sharp fluctuations of daily prices, making it easier for us to observe whether the overall price trend over a period is upward, downward, or sideways.
Simple Analogy: Imagine you want to understand a student's recent learning status.
Looking only at their most recent exam score might be one-sided (they might have performed exceptionally well or poorly).
But if you calculate the average score of their last 5 exams, you get a more stable indicator that better reflects their overall learning trend.
Moving averages do something similar for prices.
2. Main Types: Simple Moving Average (SMA) vs. Exponential Moving Average (EMA)
There are two most common calculation methods for moving averages, and their main difference lies in whether more weight is given to recent prices when calculating the average: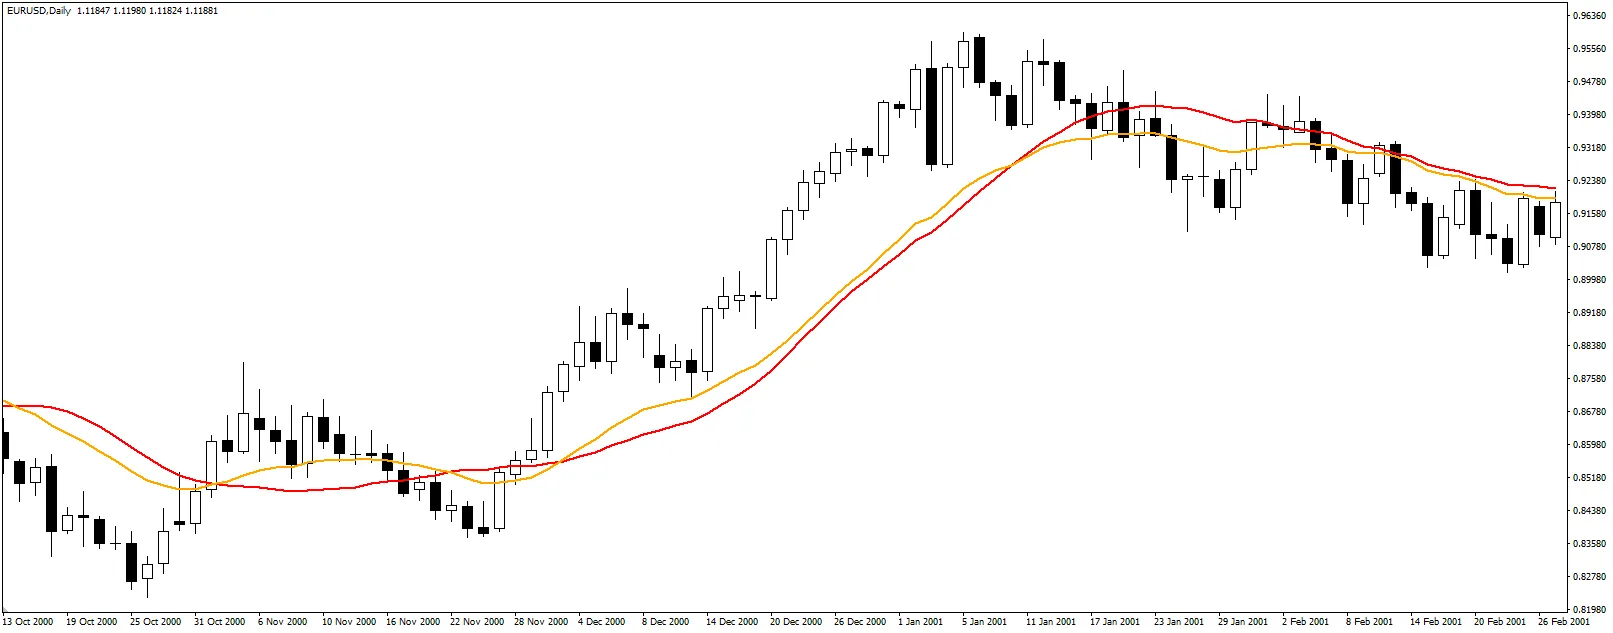
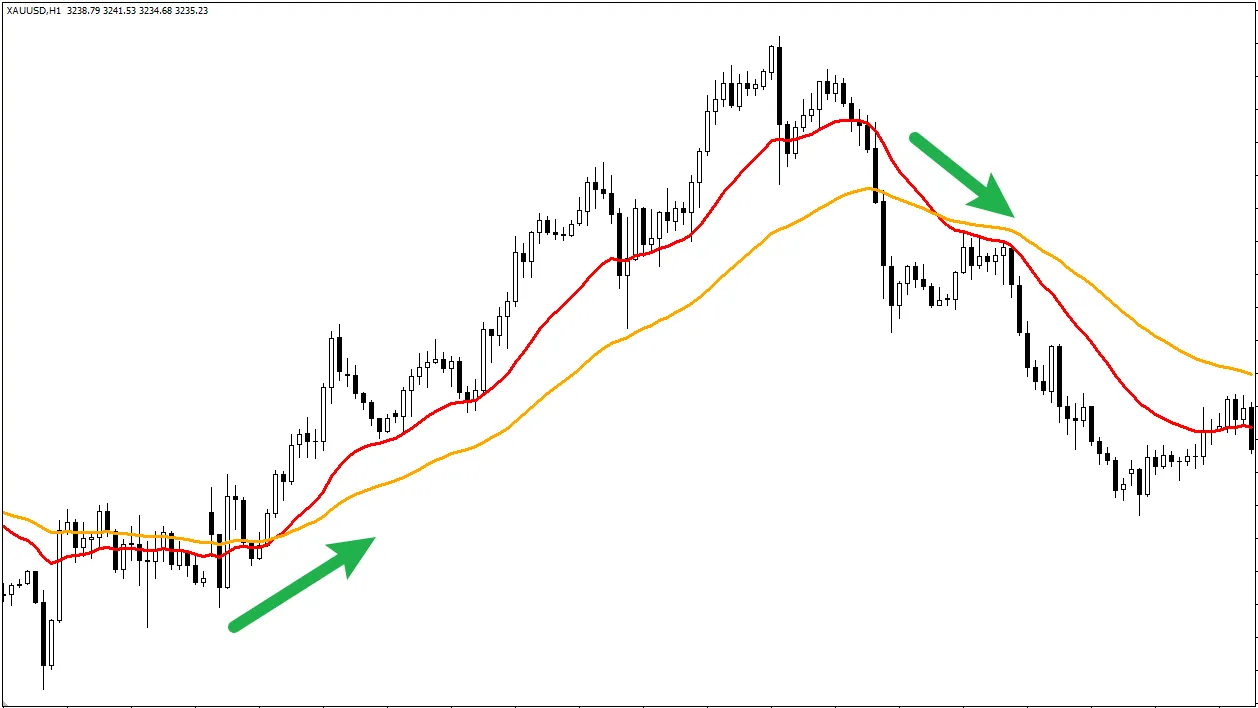
- Simple Moving Average (SMA) (Red Line):
- Calculation Concept: When calculating the average, each price data point within the selected period is given equal weight. For example, calculating a 20-day SMA means adding the closing prices of the past 20 days and dividing by 20.
- Characteristics: The resulting line is relatively smooth and reacts more slowly to sudden short-term price fluctuations.
- Exponential Moving Average (EMA) (Yellow Line):
- Calculation Concept: When calculating the average, more weight is given to more recent price data, while the weight of earlier price data decreases exponentially. In other words, EMA places more emphasis on recent price action. (The specific calculation formula is more complex and not necessary to delve into for beginners.)
- Characteristics: Because it emphasizes recent prices more, EMA reacts faster and is more sensitive to price changes than an SMA of the same period. The line is less smooth and closer to recent price movements.
SMA vs. EMA: Which is better?
There is no absolute "better," only which suits your trading style and strategy better.
- SMA: Because it is smoother and slower to react, it is more suitable for identifying medium to long-term, relatively stable trends and is less likely to be disturbed by short-term market noise.
- EMA: Because it reacts faster, it is more suitable for short-term trading strategies that require earlier signals or for closely tracking price dynamics.
3. Common Uses of Moving Averages
Moving averages are simple and intuitive, with many common applications:- Identifying Trend Direction:
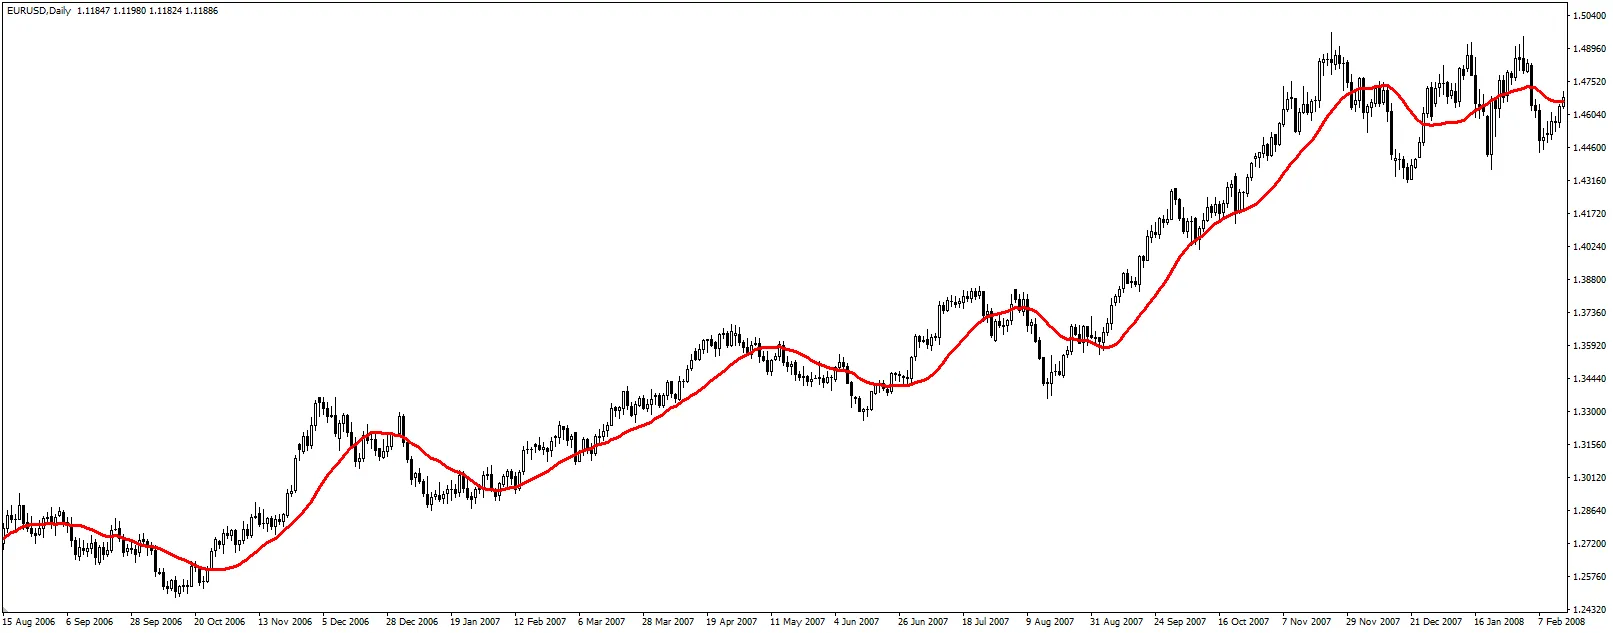
- Observing Slope: An upward sloping MA line usually indicates an uptrend; a downward sloping line indicates a downtrend; a flat line may indicate a sideways consolidation.
- Observing Price Position: Price consistently trading above a rising MA confirms an uptrend; price consistently trading below a falling MA confirms a downtrend.
- Acting as Dynamic Support and Resistance: In markets with clear trends, during pullbacks (small corrections against the trend), prices sometimes find support (in uptrends) or resistance (in downtrends) at commonly used moving averages (such as 20, 50, 100, 200 periods). Traders observe price reactions at these dynamic levels.
- Using Moving Average Crossover Signals: This is a popular method, usually using two MAs of different periods (a fast line, such as 10 or 20 periods; and a slow line, such as 50 or 100 periods):
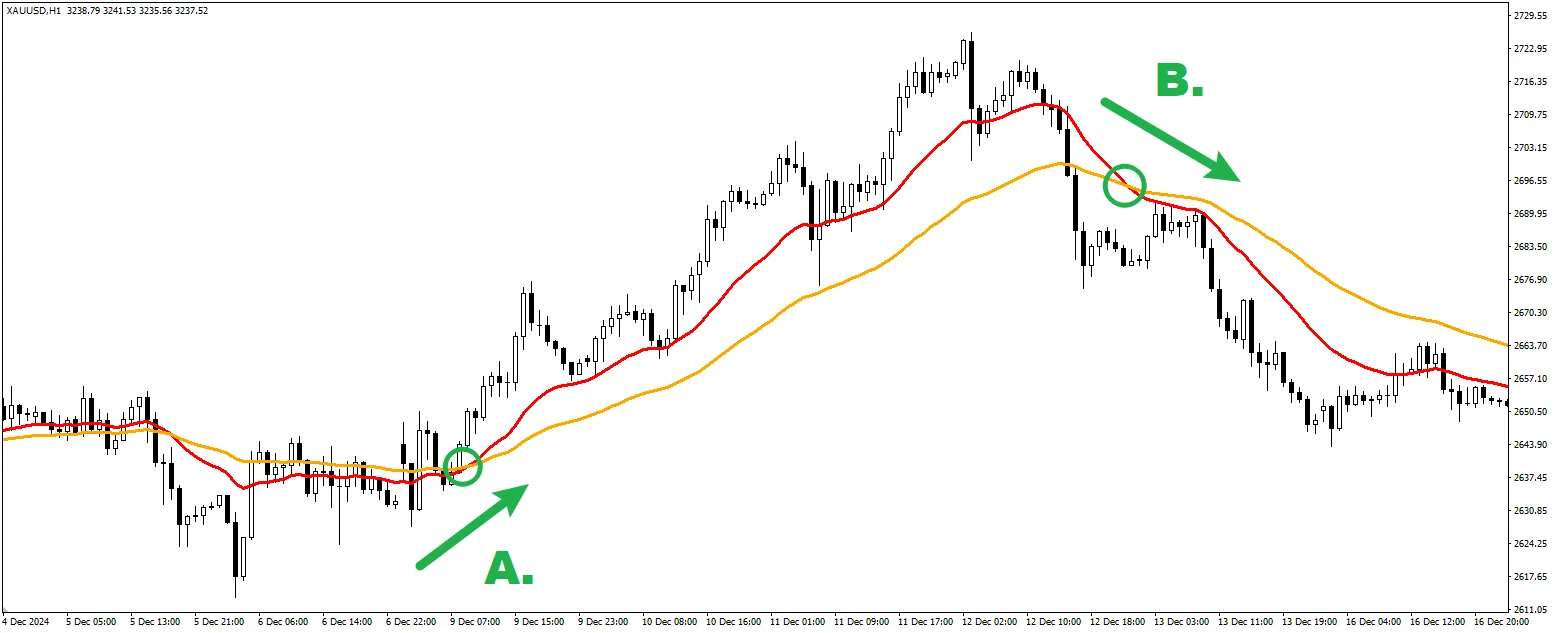
- A. Golden Cross: The fast line crosses above the slow line from below. Usually considered a bullish signal, possibly indicating the start or continuation of an uptrend.
- B. Death Cross: The fast line crosses below the slow line from above. Usually considered a bearish signal, possibly indicating the start or continuation of a downtrend.
4. How to Choose the "Period" of a Moving Average?
The number behind the MA (e.g., MA 20, MA 50, MA 200) represents the length of the time period used to calculate the average.- Shorter Periods (e.g., 10, 20): React faster to price changes, can capture short-term trends, but are more prone to noise and false signals. Suitable for short-term traders.
- Longer Periods (e.g., 50, 100, 200): React slower to price changes, filter out more noise, show longer-term and more stable trend directions, but signals appear later (stronger lag). Suitable for long-term traders or judging the bigger picture.
Commonly used periods (such as 20, 50, 200) are popular because they are widely used and may have a certain "self-fulfilling" effect.
However, no period is absolutely the best; you need to choose and test based on your trading market, timeframe, and strategy.
5. Limitations of Moving Averages
When using MAs, you must be aware of their drawbacks:- Lagging Nature: This is the fundamental characteristic of MAs. Because they are calculated based on historical prices, their turning points or signals always occur after the actual price turns. They cannot predict the future, only follow or confirm what has already happened.
- Poor Performance in Sideways Markets: When the market lacks a clear trend and prices oscillate back and forth, the MA line tends to flatten, and prices frequently cross above and below the MA line, causing crossover signals and other methods to fail and generate many losing trades. MAs are trend-following tools and perform poorly without trends.
6. Are Moving Averages Suitable for Beginners?
Absolutely! Moving averages are generally considered one of the most suitable technical indicators for beginners to start learning and using.Reasons:
- The concept is relatively easy to understand, visually intuitive (just a line following the price), and provides valuable information about market trends.
- Many simple and effective trading strategies are built around MAs.
Advice for Beginners:
- Start Simple: Add one or two commonly used MA lines to your chart, such as a shorter period EMA (e.g., EMA 20) to observe short-term dynamics, and a longer period SMA (e.g., SMA 50 or SMA 200) to judge the long-term trend background.
- Observe and Learn: In a Demo Account, carefully observe how price interacts with the MA lines. How does the slope of the MA change? What usually happens after price crosses the MA?
- Use as an Auxiliary Tool: Do not treat MA signals (such as crossovers) as absolute buy or sell commands. Use them as auxiliary judgment tools, preferably combined with basic price action analysis (such as trendlines, support and resistance levels) for comprehensive consideration.
- Recognize Their Limitations: Always remind yourself of the lagging nature of MAs and learn to identify when the market may be in a sideways consolidation, staying cautious about MA signals in such conditions.
Conclusion
Moving Averages (MA), including SMA and EMA, are indispensable foundational tools in forex technical analysis.They smooth short-term fluctuations by calculating historical average prices, helping traders identify trend direction, judge price position relative to the trend, and possibly provide dynamic support or resistance references.
SMA is smoother and more lagging, while EMA reacts faster.
Although MAs have limitations such as lagging and poor performance in ranging markets, their intuitive and easy-to-understand nature and the valuable trend information they provide make them an excellent starting point for beginners in technical analysis.
It is recommended that beginners start by learning to observe and understand one or two commonly used MAs, use them as part of their analysis framework, and always combine them with strict risk management for trading decisions.