Introduction to Forex Price Action Trading: Understanding the Original Language of the K-Line Chart
After we introduced the use of various chart patterns and technical indicators in "Technical Analysis", you might be curious whether there are traders who do not rely on these "auxiliary tools" but instead look for trading clues directly from the price movements themselves.The answer is yes, and this is the core concept of "Price Action Trading".
Price action trading is a technical analysis method that focuses on interpreting the information conveyed by the market price movements themselves.
It is usually conducted on a "clean" or "naked K" chart (i.e., a chart with few or no added technical indicators).
Proponents believe that price changes themselves contain all the information needed to make trading decisions.
This article will introduce what price action trading is, the core elements it focuses on, its advantages and disadvantages, and how beginners should approach this trading method.
1. What is Price Action Trading?
Price Action Trading is a market analysis and trading method whose decisions are mainly based on the study and interpretation of historical and current price movements themselves, rather than relying on mathematical indicators derived from price data.Core Belief: Price action traders believe that market supply and demand forces, the psychological battles between buyers and sellers, and the underlying trend strength or turning points are directly reflected in how prices move and form specific patterns on the chart.
They tend to think that most technical indicators are just lagging derivatives of price, and directly analyzing "price action" itself can provide more timely and purer market information.
Goal: By observing how prices fluctuate, how K-lines (candlesticks) form, and how they react at key levels, traders aim to predict future price movements and identify high-probability trading setups.
2. What Do Price Action Traders Focus On?
Price action traders read the "story" told by the chart.They pay special attention to the following core elements:
- K-Line / Candlestick Patterns: Specific single or combinations of K-lines are believed to reflect the market's buying and selling power comparison and sentiment at a particular time. For example, a "Doji" may indicate indecision, a "Hammer" or "Bullish Engulfing" may signal a potential bottom reversal, etc. (These are just examples; specific patterns require in-depth study).
- Market Structure: Identifying whether the current market is in an uptrend (continuously making higher highs and higher lows), downtrend (continuously making lower highs and lower lows), or ranging (moving within a range). Whether the price breaks previous structural highs or lows is an important clue to determine if the trend will continue or reverse.
- Key Levels: These are the previously mentioned Support and Resistance levels. These are areas where price has historically bounced or been resisted multiple times. Price action traders closely observe how price reacts when reaching these key levels—whether it breaks through strongly or shows hesitation and rejection signs (e.g., specific reversal candlestick patterns). These reactions themselves are important trading signals.
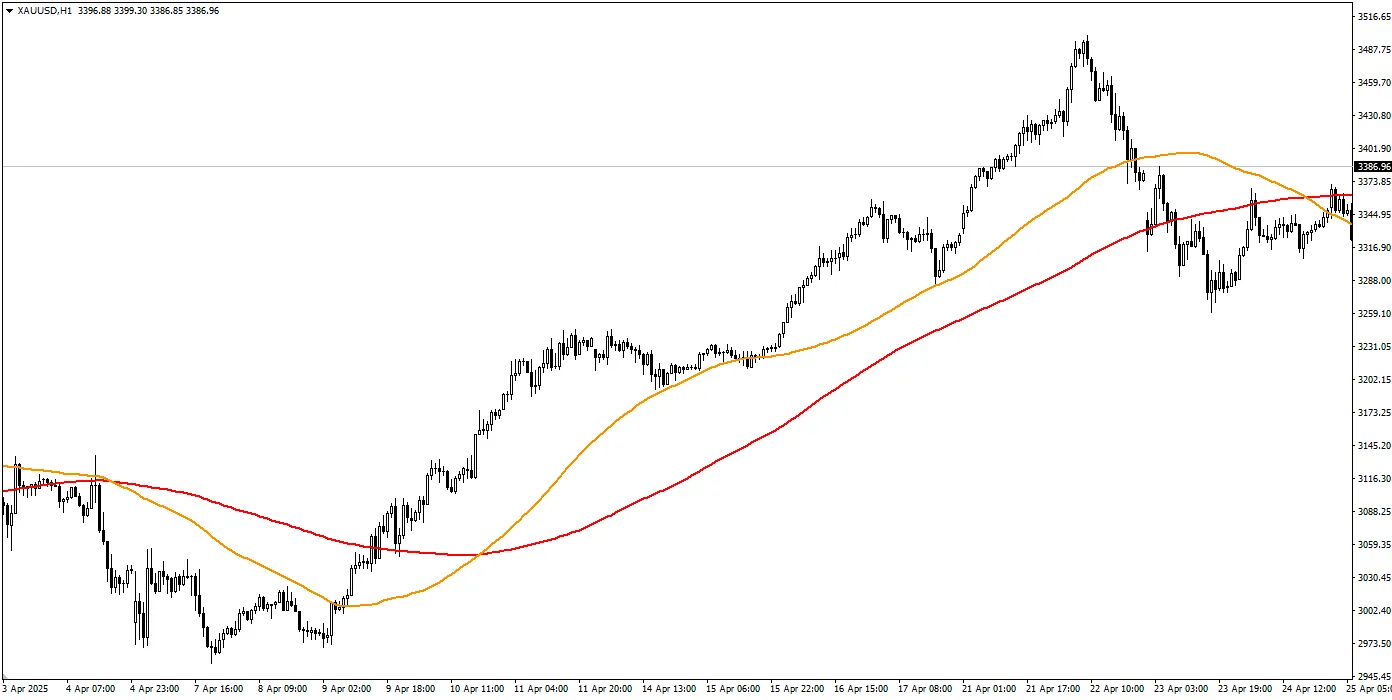
- Trend Lines & Channels: Drawing trend lines and channels by connecting a series of highs or lows helps visualize trend direction and provides potential entry or exit reference zones.
3. Advantages of Price Action Trading
- Clean and Clear Charts: Without relying on many indicators, trading charts are usually very clean, helping traders focus on the most important information—the price itself, avoiding the problem of "analysis paralysis" caused by too many indicators.
- Relatively Timely Reaction: Since it directly analyzes price, its signals come from the market's current behavior, potentially capturing market changes earlier than many lagging technical indicators.
- Strong Method Universality: The principles of price action analysis apply to almost all financial markets (forex, stocks, futures, etc.) and all trading timeframes.
- Develops Deep Market Understanding: Forces traders to carefully observe and interpret the battle between bulls and bears, which helps cultivate a deeper and more intuitive understanding of market dynamics over time.
4. Challenges of Price Action Trading
- Relatively High Subjectivity: How to define an "effective" support/resistance level? How to judge the "strength" of a candlestick pattern? How to draw trend lines? These aspects may carry a certain degree of personal subjective judgment, unlike reading specific indicator values which are more objective. It requires a lot of practice to establish consistent judgment standards.
- Requires Extensive Practice and Experience: Being able to quickly and accurately identify meaningful price action patterns and filter out market random "noise" requires long hours of monitoring, observing, summarizing, and practicing. This is not achieved overnight.
- May Miss Additional Information Provided by Indicators: Some technical indicators can provide information not directly shown by price itself from different dimensions (such as momentum changes, volatility, volume distribution, etc.). Pure price action traders may overlook these potential clues.
- May Fall into "Over-Interpretation": Sometimes traders may become overly obsessed with finding the "perfect" pattern on the chart, leading to hesitation or overreacting to insignificant fluctuations.
5. Is Price Action Trading Suitable for Beginners?
The Importance of Learning the Basics: Whether you ultimately choose to become a pure price action trader or not, learning the basics of price action knowledge (such as understanding K-lines, identifying trends, and finding key support and resistance levels) is extremely beneficial and necessary for all traders who want to learn technical analysis.Challenges for Beginners: Purely relying on price action for trading involves inherent subjectivity and a high dependence on experience, which can be difficult for beginners who have not yet developed market intuition and judgment systems.
Facing a "naked K chart" at the start may feel overwhelming.
Recommendations:
It is strongly recommended that beginners make learning basic price action a core part of their technical analysis foundation.
However, it is not necessary to pursue completely no use of any indicators from the beginning.
Many beginners find it easier to start by combining basic price action analysis (such as observing candlestick patterns near key support and resistance levels) with one or two simple, commonly used technical indicators (such as moving averages to assist in trend judgment). This approach is easier to grasp and can provide some objective reference or confirmation signals.
As experience accumulates, you can gradually reduce reliance on indicators or find the analysis system that best suits you, combining price action and indicators.
In any case, extensive simulated trading practice is crucial for developing price action interpretation skills and validating related strategies.
Conclusion
Price Action Trading is an important technical analysis school that focuses on directly interpreting the movement trajectory and patterns of price on charts, usually conducted in a clean chart environment.It relies on the analysis of core elements such as K-lines, market structure, and key levels.
Learning basic price action is a required course for all technical traders.
Although pure price action trading may be challenging for beginners due to its subjectivity and experience requirements, combining its core principles with other simple analytical tools is often a very good starting point.
The ultimate goal is to find a method you can understand, consistently execute, and verify as effective, and price action is undoubtedly an important cornerstone in building this method.