Forex RSI Indicator Tutorial: Understanding the Relative Strength Index (RSI) Overbought and Oversold Signals
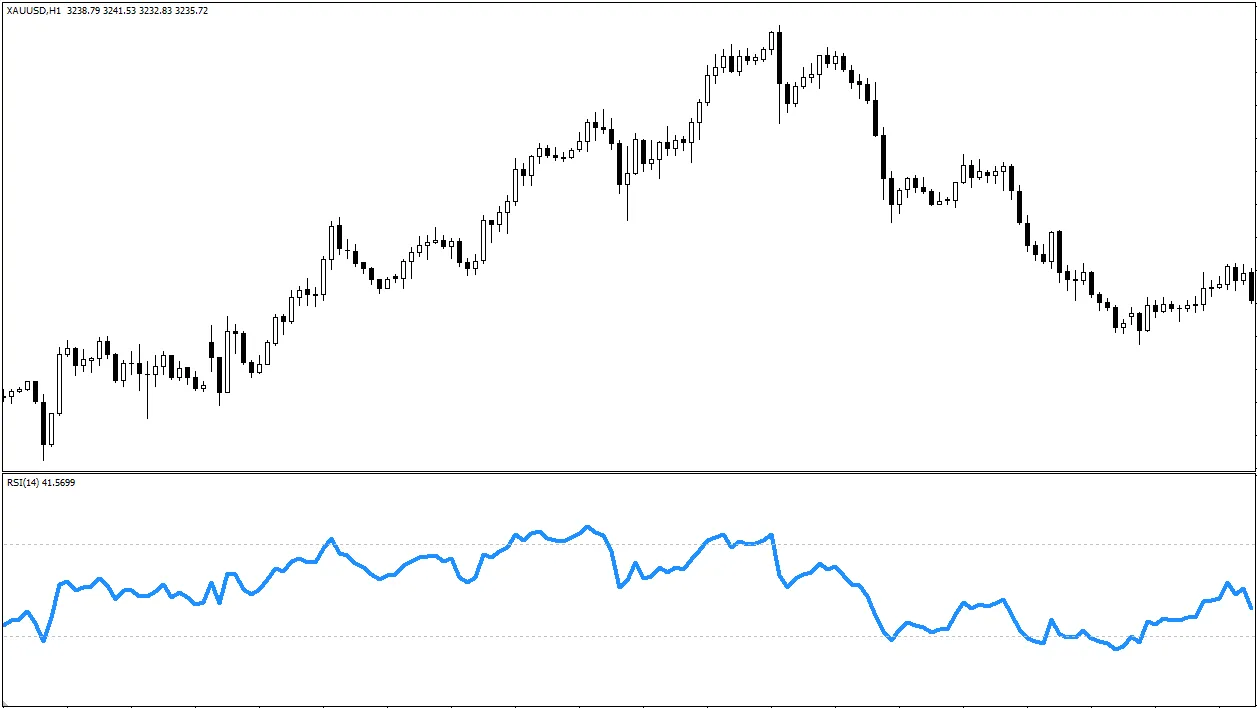
When you observe price charts on a trading platform, besides the candlesticks and moving averages on the main chart, you might also notice an independent window below the chart with a line moving up and down within a fixed range.This common indicator is most likely the "Relative Strength Index" (RSI).
Unlike moving averages, which are mainly used to determine trend direction, RSI belongs to the category of "Momentum Oscillators".
It primarily measures the speed and strength of recent price changes and helps traders judge whether the market might have entered an "Overbought" or "Oversold" condition.
Understanding RSI readings and signals can provide an additional dimension for your trading analysis.
This article will briefly introduce the basic principles of RSI, its most common uses (especially the concept of overbought and oversold), and important limitations to be aware of when using it.
1. What is the Relative Strength Index (RSI) ? The "Thermometer" for Measuring Momentum
The Relative Strength Index (RSI) was created by technical analysis expert J. Welles Wilder.It measures the relative strength or momentum of recent price changes by calculating the ratio of average gains to average losses over a certain period (the most commonly used standard period is 14 periods).
Core Feature: RSI values always fluctuate between 0 and 100. It is usually plotted in an independent window below the main price chart.
Main Function: It helps determine whether prices have risen too quickly and strongly recently (possibly overbought) or fallen too quickly and strongly (possibly oversold), indicating that the market may need to pause, pull back, or consolidate.
You can think of it as a thermometer measuring the market's short-term "heat" or "coldness".
2. Core Concept of RSI: Overbought and Oversold Zones
The most well-known use of RSI is to identify the "Overbought" and "Oversold" zones.This is usually defined by two horizontal lines:
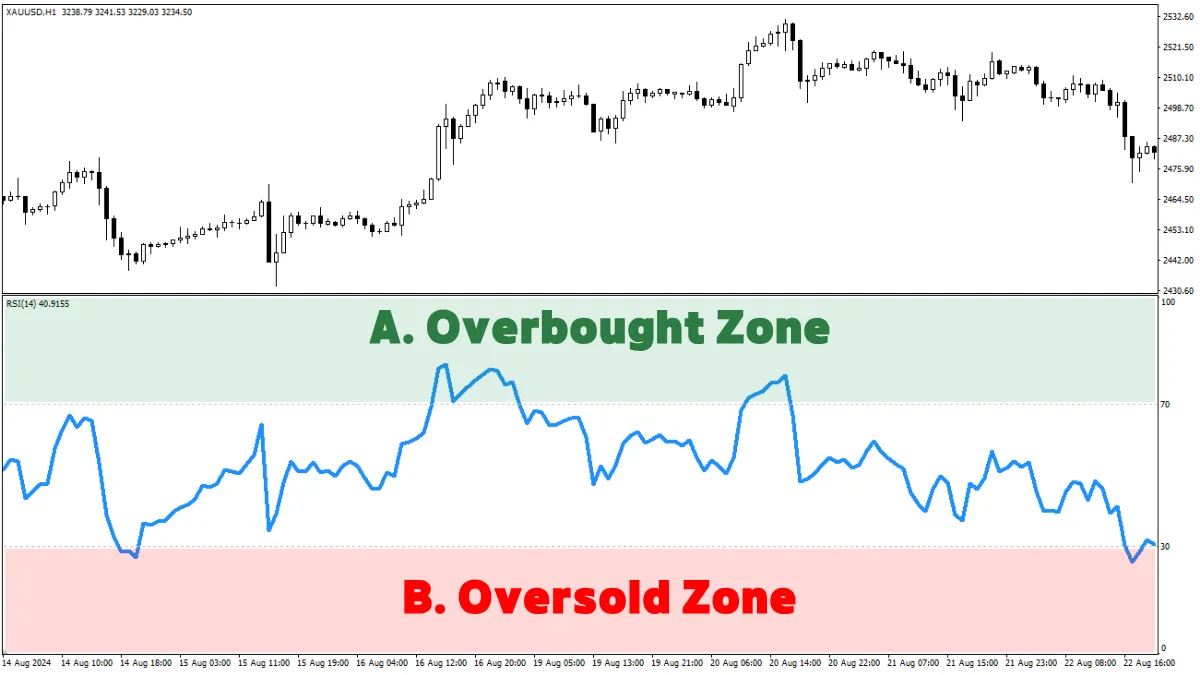
- A. Overbought Zone: When the RSI line rises above the 70 level, it is generally considered that the market has entered an "Overbought" state. This indicates that buyers have been very strong recently, with rapid and large price increases, and the market may be somewhat "overheated," suggesting a possible upcoming price pullback or sideways consolidation.
- B. Oversold Zone: When the RSI line falls below the 30 level, it is generally considered that the market has entered an "Oversold" state. This indicates that sellers have been very strong recently, with rapid and large price declines, and the market may be somewhat "overcooled," suggesting a possible upcoming price rebound or sideways consolidation.
!!! Extremely Important Warning !!!
Many beginners make a fatal mistake by immediately shorting (selling) when RSI enters the overbought zone and immediately going long (buying) when RSI enters the oversold zone.
Please remember:
- Overbought ≠ Immediate Sell Signal!
- Oversold ≠ Immediate Buy Signal!
Reason:
In a very strong uptrend, RSI may remain above 70 in the overbought zone for a long time while prices continue to rise.
Similarly, in a very strong downtrend, RSI may stay below 30 in the oversold zone for a long time while prices continue to fall.
Trading against a strong trend solely based on RSI overbought/oversold signals is very dangerous and can easily lead to significant losses!
3. Other Common Uses of RSI (Conceptual Introduction)
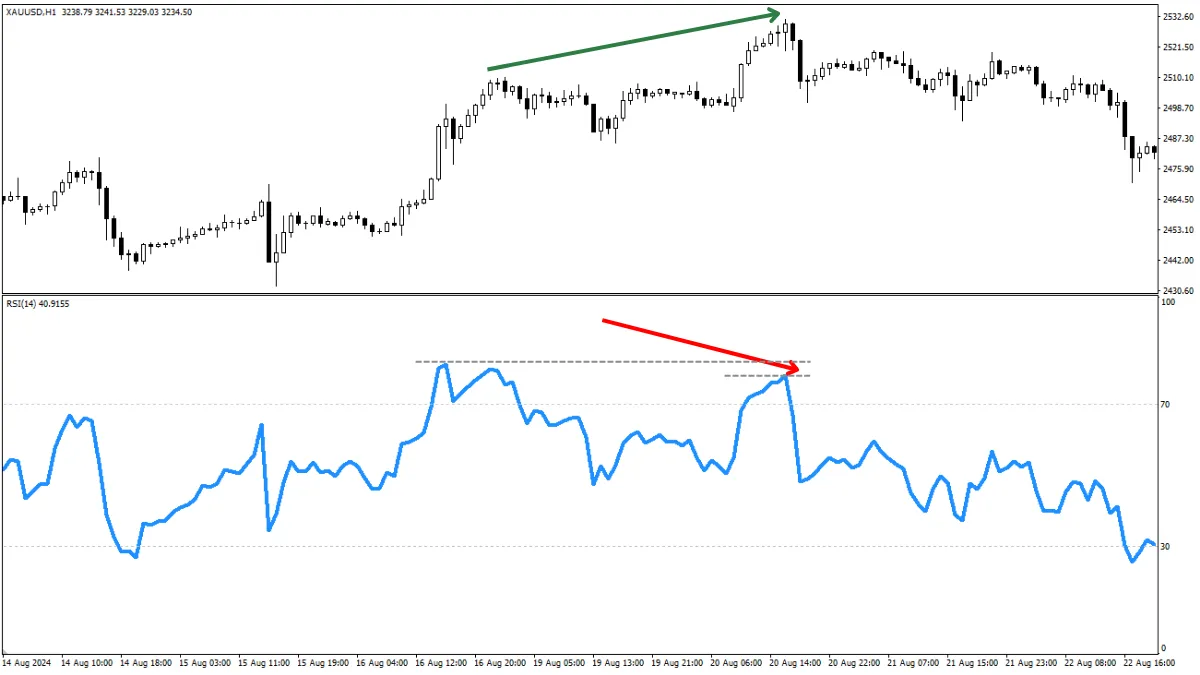
Besides overbought and oversold, traders sometimes pay attention to other RSI signals:- Divergence: Considered one of the more reliable (but still requires confirmation) signals.
- A. Bearish Divergence: Price makes a new high, but the RSI fails to make a new high (instead forming a lower high). This suggests that although prices are still rising, the upward momentum may be weakening, possibly indicating a future price pullback or reversal downward risk.
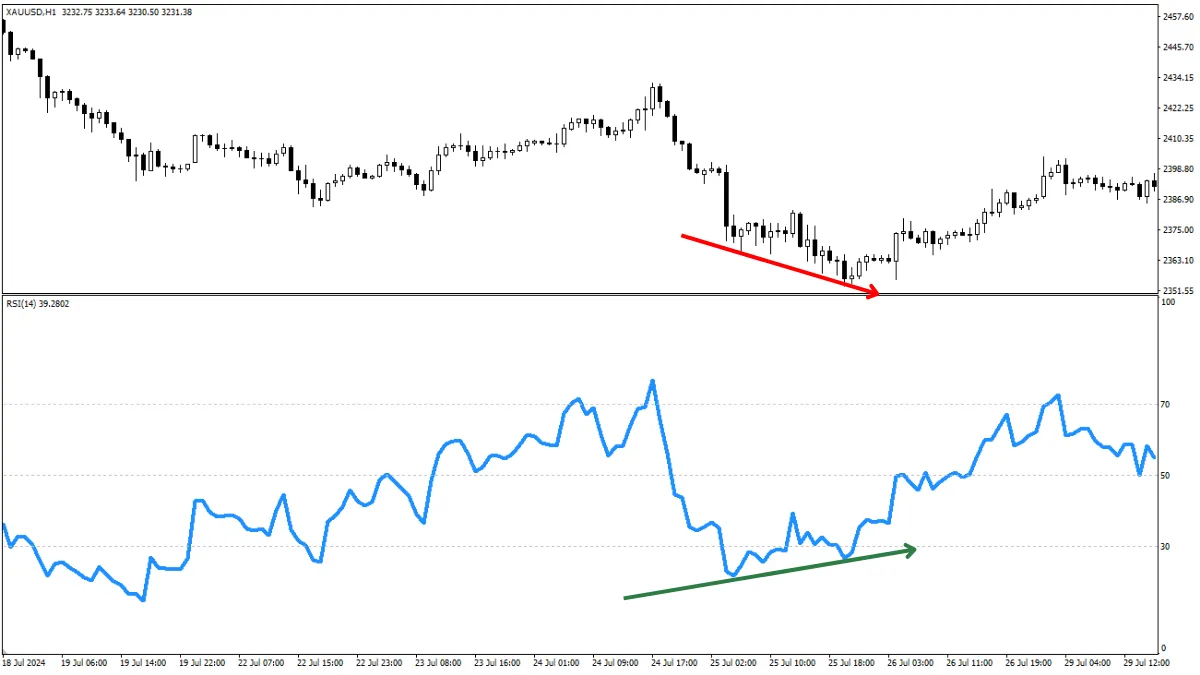
- B. Bullish Divergence: Price makes a new low, but the RSI fails to make a new low (instead forming a higher low). This suggests that although prices are still falling, the downward momentum may be weakening, possibly indicating a future price rebound or reversal upward opportunity.
- Centerline 50 Crossover: Some traders view RSI crossing above the 50 centerline as a signal of strengthening market momentum, possibly supporting bullishness; crossing below 50 is seen as weakening momentum, possibly supporting bearishness. It helps judge short-term market bias.
4. Limitations of RSI
When using the RSI indicator, it is important to understand its shortcomings:- May fail or mislead in strong trends: As mentioned earlier, relying solely on overbought and oversold signals is dangerous in very strong trends.
- Better suited for ranging markets or pullbacks within trends: RSI overbought and oversold signals tend to be more effective in sideways markets without clear trends or at the end of pullbacks within major trends (e.g., an oversold signal during a pullback in an uptrend may be a potential buying opportunity), but caution is still needed.
- Can produce false signals: Like all technical indicators, RSI can give false signals and should not be used as the sole basis for trading decisions.
5. Is RSI Suitable for Beginners?
- Relatively easy to understand conceptually: The basic principle of RSI (measuring momentum), its 0-100 range, and the concept of overbought/oversold (especially with the important warning understood) are relatively easy for beginners to grasp.
- High risk of misuse: Beginners often make the mistake of treating overbought and oversold as direct reversal signals, especially when trading against the trend, which carries high risk.
Recommendations:
- RSI is a useful indicator worth learning for beginners, provided it is correctly understood and used.
- Start with observation: Add RSI to charts in a Demo Account (usually using the default 14 periods and marking the 70 and 30 levels). Carefully observe how RSI behaves under different market conditions (strong trends vs. sideways). How long does RSI stay in overbought/oversold zones? Does price always immediately reverse?
- Combining with trend is key: Always consider RSI signals within the context of the overall market trend! For example, in an uptrend, an RSI pullback into the oversold zone may be a potential buy opportunity aligned with the trend; in a downtrend, an RSI rebound into the overbought zone may be a potential sell opportunity aligned with the trend. Avoid shorting a strong uptrend just because of overbought, or buying a strong downtrend just because of oversold.
- Be cautious with divergence: Divergence can be a useful alert but requires confirmation from price action or other signals. Beginners do not need to force mastering it initially.
- Use as an auxiliary tool, not the only one: Use RSI as part of your analysis toolbox to assist in judging momentum conditions or identifying potential pullback ends, but always combine it with price action (support/resistance, candlestick patterns), trend analysis (such as moving averages), and other factors for final decisions.
Conclusion
The Relative Strength Index (RSI) is a commonly used momentum oscillator that measures the relative strength of recent price changes, fluctuating between 0 and 100, mainly used to identify potential overbought (usually > 70) and oversold (usually < 30) conditions.The most important point for beginners learning RSI is to remember: Overbought does not mean immediate sell, and oversold does not mean immediate buy, especially in strong trending markets!
It is also important to understand its other uses (such as divergence and centerline crossovers) and limitations (such as dullness and false signals in trending markets).
RSI is a valuable auxiliary tool for beginners, but its signals must be interpreted within the correct market trend context and combined with other analysis methods and strict risk management.