Forex Technical Analysis Cornerstone: Understanding Support and Resistance
When you observe forex price charts, do you often feel that the price seems to "get stuck" at certain specific levels?Sometimes, the price falls to a certain point as if it hits a floor, stops falling, or even rebounds upward; other times, the price rises to a certain point as if it hits a ceiling, making it difficult to break through or even turning downward.
These key price level areas where the price "stops" or "reverses" are the famous "Support" and "Resistance" in technical analysis.
Understanding what support and resistance are, how they form, and how to find them on charts can be said to be the cornerstone of learning technical analysis.
They provide traders with important clues about potential market turning points and critical battlegrounds.
This article will explain these two core concepts to you in the simplest way.
1. What is Support? The "Floor" of Price Decline
Definition: Support refers to a price level or area on the chart located below the current market price.Historically, when the price falls to this area, buyers' interest and strength often increase enough to resist or even exceed sellers' strength, thereby preventing the price from continuing to fall and possibly triggering a price rebound.
Simple Visualization: You can think of support as a "floor" or "safety net" when the price falls; the price is easily "held up" here.
Why does it form? Possible reasons include: traders believing the price is cheap enough here to buy; bulls who previously bought at this level may buy again to "defend" their position; bears (sellers) may choose to take profits and close positions here.
2. What is Resistance? The "Ceiling" of Price Rise
Definition: Resistance refers to a price level or area on the chart located above the current market price.Historically, when the price rises to this area, sellers' interest and strength often increase enough to resist or even exceed buyers' strength, thereby preventing the price from continuing to rise and possibly triggering a price pullback.
Simple Visualization: You can think of resistance as a "ceiling" or "pressure wall" when the price rises; the price is easily "blocked" here.
Why does it form? Possible reasons include: traders believing the price is too expensive here and worth selling; buyers previously trapped at this level may choose to sell to break even; bulls (buyers) may choose to take profits and close positions here.
3. How to Identify Support and Resistance? Looking for Historical "Marks"
Identifying support and resistance mainly involves observing historical price charts to find places where the price has made obvious reactions.Common methods include:
- Observing previous swing highs and lows:
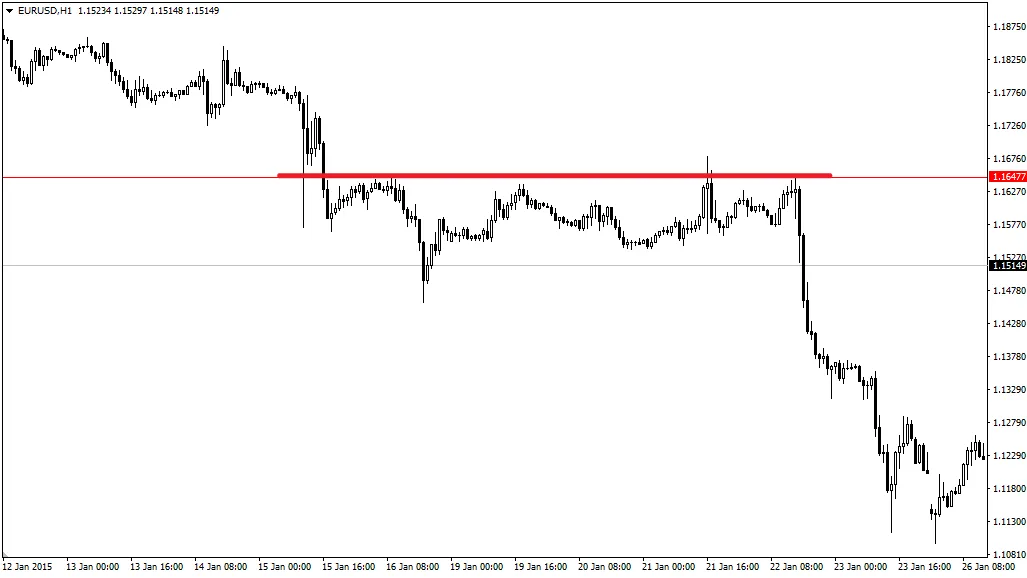
Past important highs where the price reversed downward (peaks) often form future resistance levels.
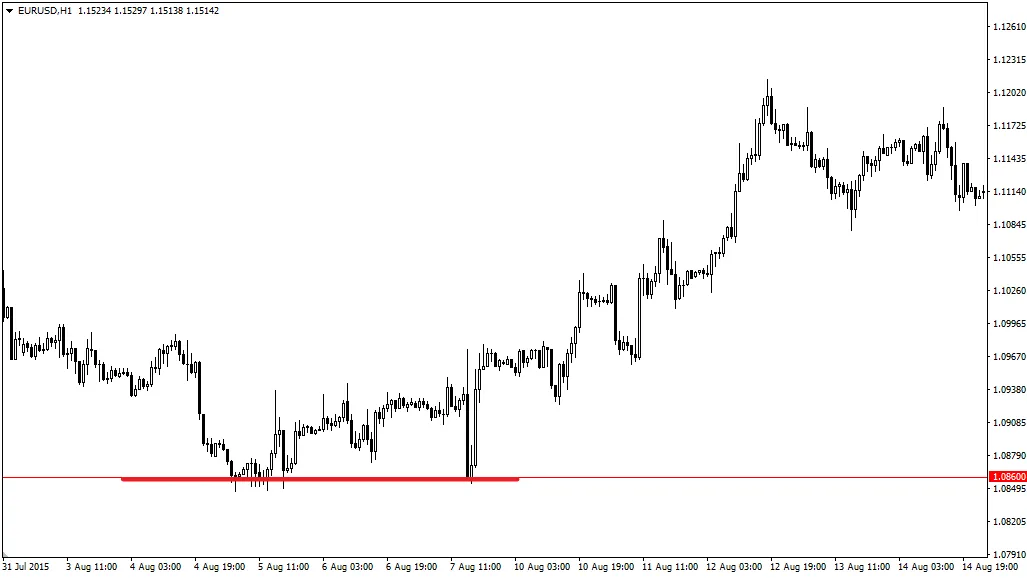
Past important lows where the price reversed upward (troughs) often form future support levels.
The more times a swing high/low is tested or the larger the subsequent move it triggers, the stronger its significance as support/resistance usually is. - Looking for price levels repeatedly touched and reversed: If the price has stopped advancing and reversed multiple times near a certain level in the past, that price area forms a relatively reliable support or resistance zone. The more tests without breakthrough, the stronger the level.
- Paying attention to round numbers or psychological levels: Large round numbers like 1.1000, 1.2000, 130.00, or levels ending with 50 (e.g., 1.1050) often become psychological support or resistance because many traders tend to place orders near these round numbers.
- Other technical tools can also provide support and resistance: Trendlines, moving averages (which provide dynamic support/resistance), and Fibonacci retracement levels can also be considered different forms of potential support or resistance.
Important Concept: Treat Support and Resistance as "Zones" rather than "Exact Lines"
Although we often draw a line to mark support and resistance, in actual trading, it is usually more effective to understand them as a price range or zone.
Because the market rarely reverses perfectly at an exact price point, the price may slightly break through and then return, or react in advance near that level.
4. Key Concept: Role Reversal of Support and Resistance
This is a very, very important principle:- When a strong resistance level is decisively broken upward by price, this original "ceiling" often turns into a "new floor" during future price pullbacks, becoming support.
- When a strong support level is decisively broken downward by price, this original "floor" often turns into a "new ceiling" during future price rebounds, becoming resistance.
This "role reversal" principle is crucial for understanding price behavior after breakouts and for finding potential trading opportunities (such as entering on retests of the broken level).
5. How Do Traders Use Support and Resistance?
Support and resistance levels are fundamental elements for formulating trading plans. Common applications include:- Finding potential entry opportunities:
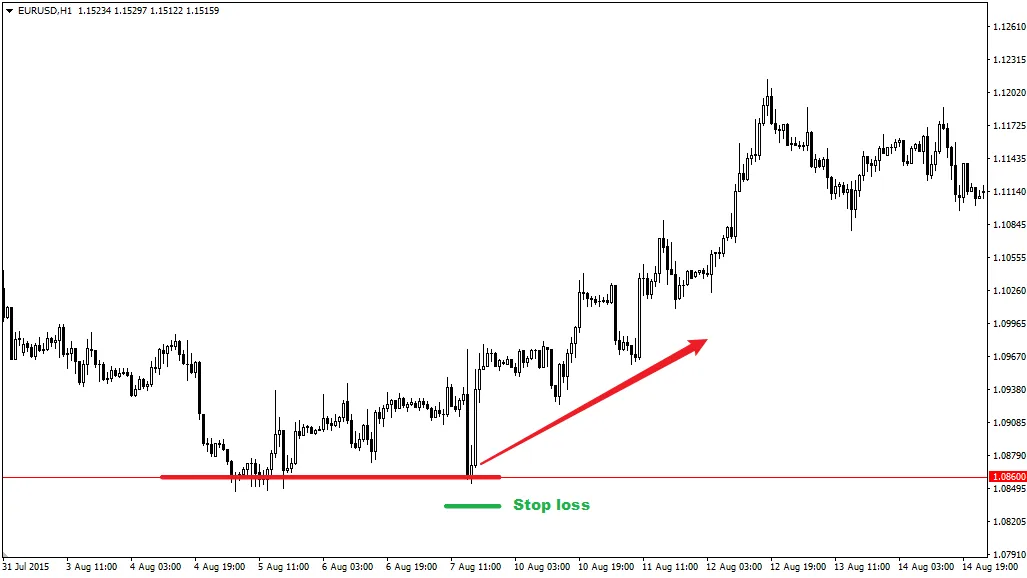
- Rebound/Resistance Trading: When the price approaches a strong support level and shows signs of rejecting further decline, possibly rebounding (e.g., bullish candlestick patterns), consider buying. When the price approaches a strong resistance level and shows signs of rejecting further rise, possibly pulling back (e.g., bearish candlestick patterns), consider selling. (Requires confirmation with price action)
- Breakout Trading: Buy after the price breaks above an important resistance level, expecting trend continuation. Sell after the price breaks below an important support level, expecting trend continuation. (Requires managing false breakout risks)
- Retest Trading: After the price breaks a level (e.g., resistance), wait for a pullback to test the newly broken level (which may now act as support). If support holds again here, buy in the direction of the breakout.
- Setting Stop-Loss Points: Support and resistance provide logical bases for stop-loss placement. For example, when buying, place stop-loss slightly below the relevant support; when selling, place stop-loss slightly above the relevant resistance.
- Setting Take-Profit Targets: Traders may set the next important support level (for short positions) or resistance level (for long positions) as profit-taking targets.
6. Are Support and Resistance Suitable for Beginners?
Yes, absolutely! Understanding and identifying basic support and resistance levels is a fundamental skill every forex beginner must master in technical analysis, arguably one of the first concepts to learn.Learning Focus for Beginners:
- Start with obvious horizontal levels: Practice identifying horizontal support and resistance levels formed by past important and obvious swing highs and lows.
- Focus on longer timeframes: Look for and draw S/R levels on daily (D1) or 4-hour (H4) charts, as levels on longer timeframes are usually more reliable and less affected by short-term noise.
- Practice drawing lines: On Demo Account charts, draw the horizontal lines you identify and observe how the price interacts with these lines in the future.
- Understand role reversal: Remember the principle that support can turn into resistance and resistance can turn into support.
- Treat as reference zones: Initially, do not treat S/R levels as absolute buy or sell points. Consider them as "zones" to watch closely. When the price approaches these zones, look for other confirmation signals (e.g., specific candlestick patterns, confluence with other indicators) to assist decision-making.
Conclusion
Support (potential "floor" for price decline) and resistance (potential "ceiling" for price rise) are the most basic and important concepts in technical analysis.They represent price areas where buying and selling forces historically reached relative balance or experienced turning points, mainly identified by observing past swing highs and lows.
Understanding support and resistance, as well as their possible "role reversal" after being broken, is crucial for judging market structure, finding potential trading opportunities, and setting risk control points (stop-loss) and profit targets.
For beginners, learning to identify and apply basic support and resistance levels is the foundation for building technical analysis skills and an indispensable part of any trading plan.
Remember to always seek confirmation signals and combine them with strict risk management.