Stop Looking at Profit Screenshots! Professional Investors Only Trust "Myfxbook Verified"
There is a famous saying in the trading world: "If you don't have a third-party verified track record, everything you say is nonsense."
When you see those tempting "blue profit screenshots" or "100% win rate reports" on Telegram, please calm down and ask yourself one question: Is this data real? In an era where image editing software and demo accounts are rampant, the cost of a screenshot is almost zero.
As a responsible quantitative team, we will teach you how to use Myfxbook to identify the truth, just like institutional investors do.
Warning: An increase in account Balance does not mean the account is safe; you must check the Equity to know the real situation.
2. Myfxbook: The "Only Truth" in the Forex World
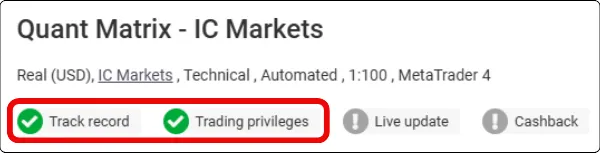
Myfxbook is an independent third-party auditing platform. It directly connects to the underlying data of the trading account and cannot be tampered with manually. When you view an account, be sure to look for those two "green checkmarks":
✅ Track Record Verified:
This means the data is read directly from the broker's server, leaving no possibility for modification.
✅ Trading Privileges Verified:
This means the publisher actually has control over this account, rather than just stealing someone else's screenshot.
If a "guru" or teacher refuses to provide a Myfxbook link, or if the link lacks these two checkmarks, block them immediately.
3. Don't Look at "How Much Earned," Look at "How Much Dropped" (Drawdown)
Novices look at profit; veterans look at drawdown (Drawdown, abbreviated as DD).
If an account has earned 100% but experienced a maximum drawdown of 80% in the process, it means it could blow up at any time. This isn't trading; it's gambling with your life.
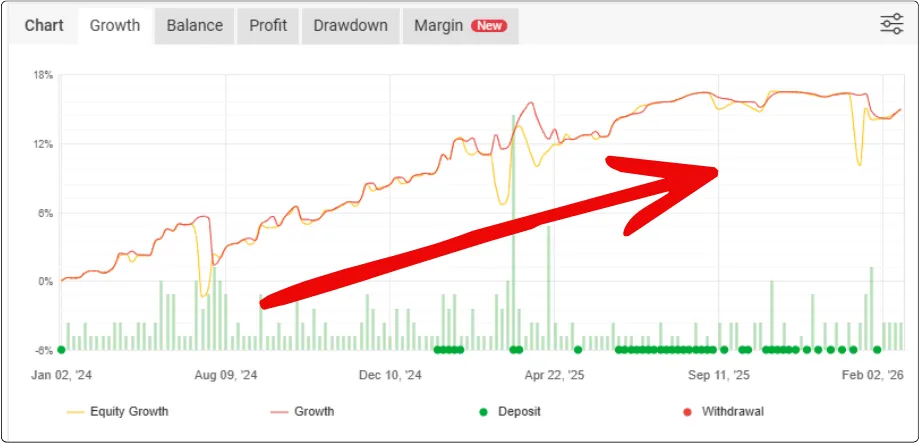
Professional Standard: We pursue a smooth upward-sloping curve. A system that can control the maximum drawdown within 10%~20% and consistently remain profitable is a truly trustworthy quantitative model.
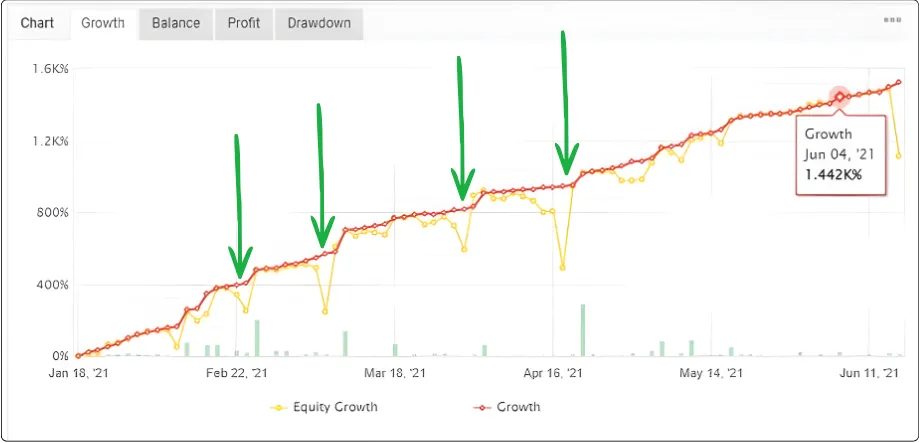
4. Balance vs. Equity: Exposing the Floating Loss Trap
Many "scammer gurus" show a constantly rising "Balance," but their "Equity curve" is plunging into an abyss. This means they refuse to use stop-losses and are holding massive floating losses in the account. Once the market fails to reverse, the account hits zero instantly.
On Myfxbook: You can see if the red equity line is closely following the yellow balance line. If the two diverge too far, run away!
Our Commitment: Transparency is Our Only Language
We do not send unverifiable screenshots. We directly make the live account links of our trading signals public. You can monitor every single trade, every bit of drawdown, and every point of profit 24/7. Because only the truly strong dare to subject themselves to the scrutiny of third-party auditing.
Conclusion: How to Allocate Assets After Learning to Read Data?
Learning to distinguish truth from falsehood is only the first step. In the real market, no strategy is invincible forever. How do professional investors use a "multi-strategy portfolio" to resist market risk?