
How to Understand MT5 Backtesting Reports? (A Must-Learn for Beginners)
Congratulations! You have learned how to backtest an Expert Advisor (EA) in MetaTrader 5 (MT5).Backtesting is like running a simulated exam for your EA strategy using past market data.
After running it, MT5 will provide you with a detailed "report card," which is the backtesting report.
Understanding this report is very important because it helps you preliminarily judge how the EA strategy performed in the past and what potential risks it may have.
This article will teach you how to understand the most important parts of the report.
Where to Find the Report?
After the backtest is completed, several new tabs will appear in the "Strategy Tester" panel at the bottom of MT5.The most important results are usually found in:
- The "Backtest" tab: Here you will find detailed statistics and a list of trades.
- The "Graph" tab: Here the capital changes are displayed graphically.
You can right-click the report in the "Backtest" tab and select "Save Report" to save it as a web file (HTML format) for detailed review later.
Key Numbers to Understand in the Report (in the "Backtest" tab):
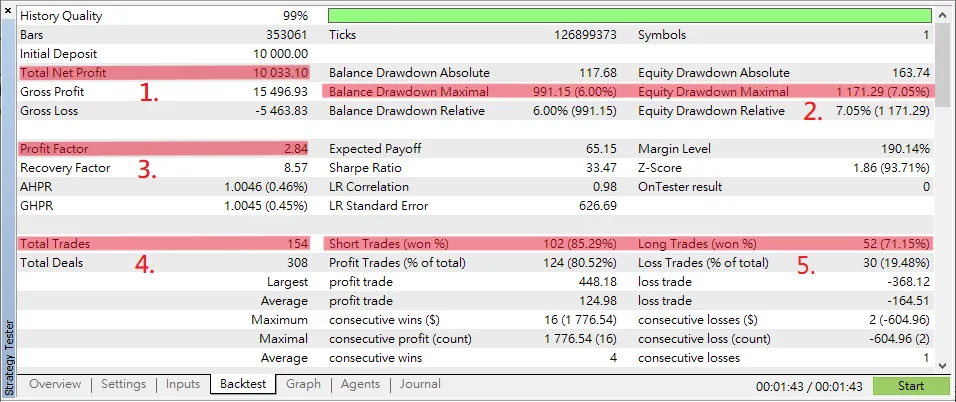
1. Total Net Profit:
Meaning: This indicates how much money the EA strategy earned or lost during the entire backtesting period. A positive number means profit, and a negative number means loss.Note: This is the most direct result, but do not only look at this number. High profits may also come with high risks.
2. Maximal Drawdown:
Meaning: This number tells you how much your Demo Account balance dropped from its highest point during the backtesting period. The report usually shows an amount and a percentage.Why It Matters: This number represents the maximum risk or "worst-case scenario" the strategy might encounter. A lower percentage usually indicates better loss control and relatively lower risk. It is one of the most important indicators for risk assessment.
3. Profit Factor:
Meaning: This is the ratio of total profit (sum of all winning trades) to total loss (sum of all losing trades).Why It Matters:
- If the profit factor is greater than 1, it means the strategy earned more than it lost during backtesting.
- If the profit factor equals 1, it means the earnings and losses are equal.
- If the profit factor is less than 1, it means the losses exceed the earnings.
Generally, a higher profit factor is better (e.g., greater than 1.5 or 2), but it should be considered alongside other indicators.
4. Total Trades:
Meaning: This indicates how many buy and sell trades the EA executed during the backtesting period.Why It Matters: If the number of trades is too low (e.g., only a few dozen), the backtest results may not be reliable and could be due to luck. A sufficient number of trades (e.g., several hundred or more) is needed for the results to be more meaningful.
If the number of trades is very high, trading costs (such as spread and commission) may significantly impact the final results and should be taken into account.
5. Win Rate (Win Rate / Profit Trades %):
Meaning: This is the percentage of profitable trades out of all trades.Note: A high win rate sounds good but does not necessarily mean the strategy is good. If each winning trade earns only a small amount but losing trades lose a lot, even a high win rate can result in an overall loss. It should be considered together with the profit factor and average profit/loss ratio.
Understanding the Graph: Capital Curve (Graph)
Besides numbers, the "Graph" tab is also very intuitive.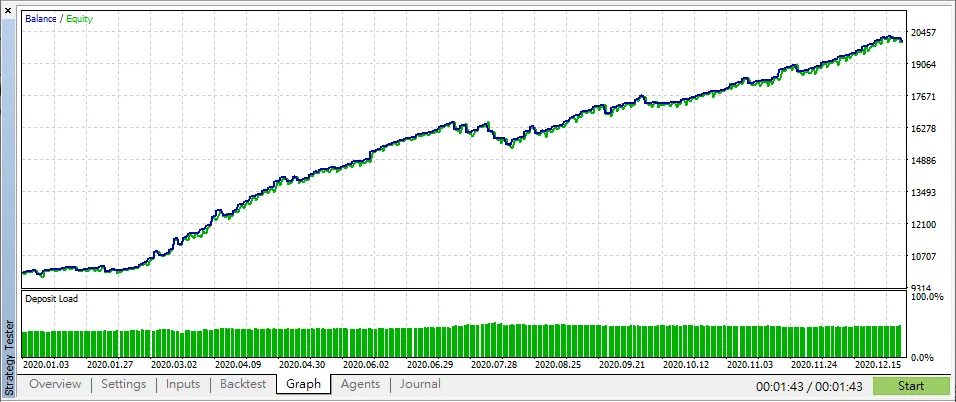
What It Is: This is a curve showing your Demo Account balance (usually a blue balance line and a green equity line) over time.
How to Read It:
- A steadily upward curve usually indicates the strategy performed relatively stably and continuously profited in the past.
- A highly volatile curve with sharp ups and downs, even if ultimately profitable, may indicate higher risk and a rollercoaster-like emotional experience. Pay attention to the depth of the drawdowns, which relates to max drawdown.
- A long-term downward curve clearly indicates the strategy was losing money in the past.
Deep Dive: More Useful Charts
Besides the basic capital curve, the bottom of the "Backtest" tab in the MT5 backtesting report provides some more detailed charts to help you better understand the EA's behavior patterns. These charts offer richer information to help you comprehensively understand the EA's characteristics:A. Time Analysis
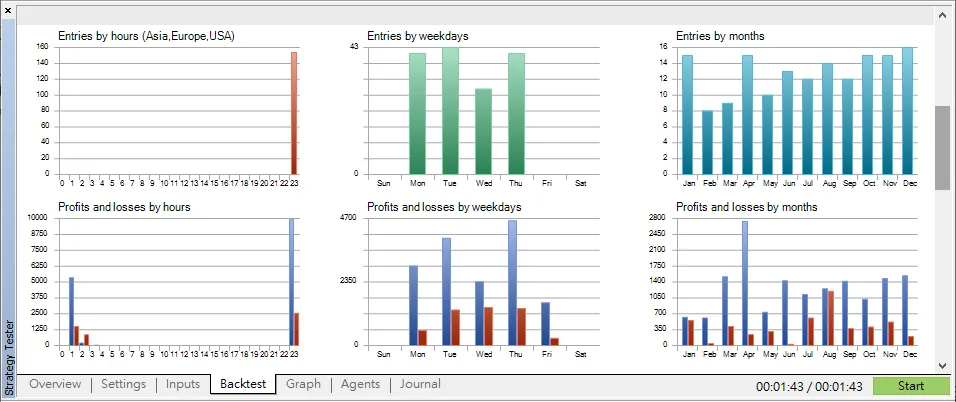
Meaning: Here are several charts showing:
- At which hours of the day, days of the week, and months of the year the EA prefers to enter trades (entry frequency distribution).
- The profit or loss situation of the EA's trades during these different time periods (profit/loss distribution).
Why Look at This: This helps you understand if the EA has obvious "active hours." For example, is it only active during certain market sessions (like London or New York sessions) ? Or does it perform particularly well or poorly on Fridays? This helps judge the strategy's suitable environment and potential patterns.
B. Correlation Chart (Correlation - MFE/MAE)
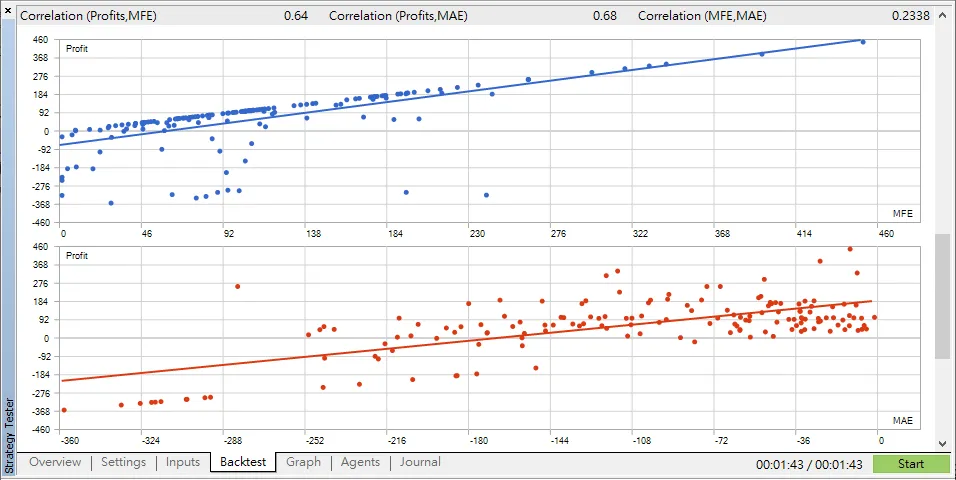
Meaning: This chart analyzes the volatility during individual trades.
- MFE (Maximum Favorable Excursion): This means the highest profit the trade reached on paper between opening and closing, even if the final closed profit was less.
- MAE (Maximum Adverse Excursion): This means the largest loss the trade experienced on paper between opening and closing, even if the final closed loss was less or even turned into a profit.
This chart usually plots MFE and MAE against the trade's final actual profit or loss using a scatter plot.
Why Look at This: This is a more advanced chart mainly used to evaluate the efficiency of the exit strategy.
For example, you can observe:
- Are there many trades with high MFE (high potential profit) but low final actual profit? → This may suggest the EA closed trades too early, missing out on potential gains.
- Are there many trades with high MAE (high potential loss) ? → This may suggest the EA's stop-loss points are set too far or that losing trades were held too long, incurring unnecessary interim losses.
In short, it helps check if the EA tends to "not earn enough on profitable trades" or "lose too much on losing trades," prompting consideration of exit mechanism optimization.
C. Holding Time vs P/L Scatter Plot
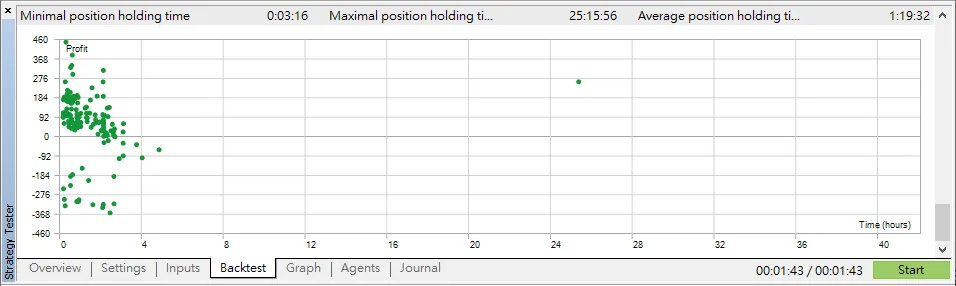
Meaning: This is a scatter plot, the kind of chart you provided.
- The X-axis (horizontal) represents the holding time of each trade from opening to closing (usually shown in hours).
- The Y-axis (vertical) represents the final profit or loss amount of that trade.
- Each point on the chart represents a completed trade.
Why Look at This: This chart lets you intuitively see the relationship between holding time length and profitability.
For example, you can observe:
- Are most profitable points (Y-axis > 0) concentrated within a certain holding time range (e.g., points mainly clustered between 0-4 hours) ?
- Are trades with particularly long holding times (far right on X-axis) usually big winners or big losers (based on Y-axis position) ?
- Is the strategy mainly short-term (points clustered on the left) or does it have a wide time distribution?
This helps understand the strategy's characteristics, such as "Does this EA tend to lose more the longer it holds trades?" or "Does it mainly profit from quick trades?"
Most Important Reminders (Must-Read for Beginners):
- Past Does Not Equal Future: The backtesting report shows the strategy's past performance. This does not guarantee the same results in real future markets. Market conditions are always changing.
- Beware of Over-Optimization: Sometimes people keep adjusting EA parameters to make the backtest report look perfect. But such "tailored" strategies may only work on past data and not adapt well to future markets. This is called "over-optimization" or "curve fitting."
- Backtesting Is Only the First Step: After reviewing the backtest report, if you think the EA strategy looks good, the next step is to test it on a Demo Account. Let it run in a live market environment for a period (at least several weeks or months) to see actual performance before considering real money.
Understanding MT5 backtesting reports is an important step in evaluating an EA, but it is definitely not the final step.
It helps you filter out obviously bad strategies and understand potential risks and behavior patterns, but always remain cautious and combine with demo testing for final judgment.


3 Responses
We stumbled over here different web page and thought
I should check things out. I like what I see so
now i’m following you. Look forward to looking at your web
page again.
This really answered my problem, thank you!
Thx