Introduction to Forex Technical Analysis: Understanding Chart Language and Finding Trading Clues
IntroductionWhen you hear forex traders discussing "reading charts," "finding patterns," or "using indicators," they are most likely applying "technical analysis".
Unlike "fundamental analysis", which focuses on economic data and news events, technical analysis is a method that concentrates on studying the market's own behavior (mainly price movements and trading volume) to identify patterns and predict future price directions.
Many beginners may wonder: Can simply looking at past charts really predict the future?
Does it sound a bit mysterious? What exactly is technical analysis? What are its common tools?
This article will unveil the mystery of technical analysis, introduce its core concepts, main tool categories, and how beginners can start learning and applying it.
1. Core Concepts of Technical Analysis: Market Action Discounts Everything
Technical analysis has become a widely used market analysis method based on several core assumptions or concepts (you don’t need to fully agree, but you need to understand them):- Market Action Discounts Everything: Technical analysts believe that any factor that might affect price (including economic, political, social, psychological factors, etc.) is already reflected in the market’s price and volume. Therefore, focusing on price changes alone is sufficient.
- Prices Tend to Move in Trends: Market price movements are usually not completely random but tend to form certain trends (uptrend, downtrend, or sideways consolidation), and once a trend forms, it often continues for some time. One goal of technical analysis is to identify trends as early as possible.
- History Tends to Repeat Itself: Since markets are driven by people, and human psychology (such as fear and greed) tends to react similarly in similar environments, certain chart patterns that caused price rises or falls in the past may reoccur in similar forms in the future.
In simple terms, technical analysis focuses more on "What is the price doing?" rather than "Why is it doing that?".
2. What Do Technical Analysts Look At? Main Tool Categories
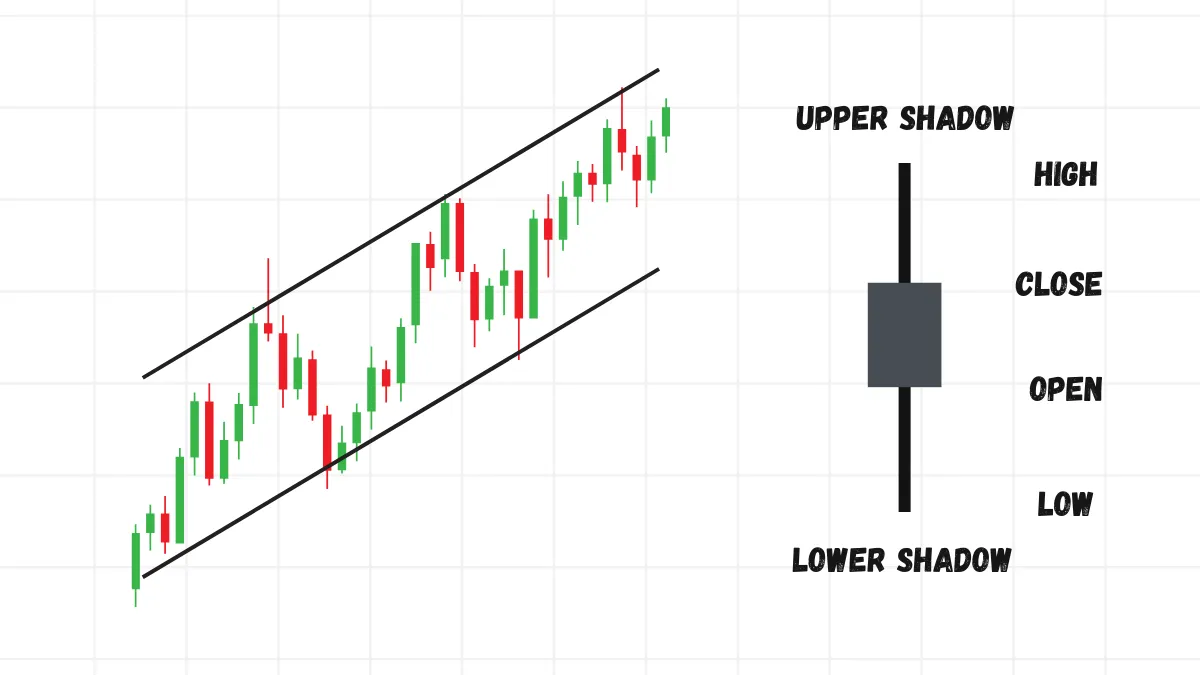
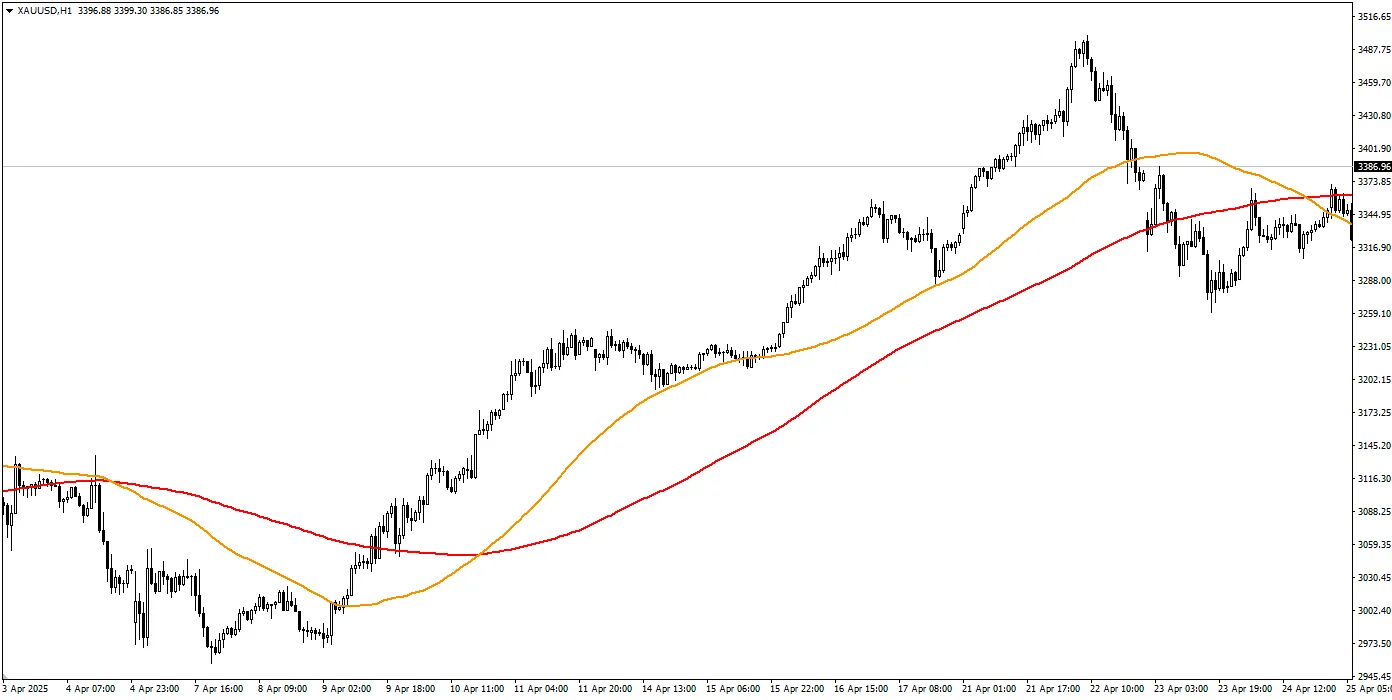
The primary workspace for technical analysis is the "price chart."The most common is the Candlestick Chart (also called K-line chart), which clearly shows the open, high, low, and close prices within a time period (such as one minute, one hour, or one day). Different candlestick combinations can form specific patterns.
Commonly used tools by technical analysts can be roughly divided into the following categories (this is just an introduction; detailed usage requires deeper study):
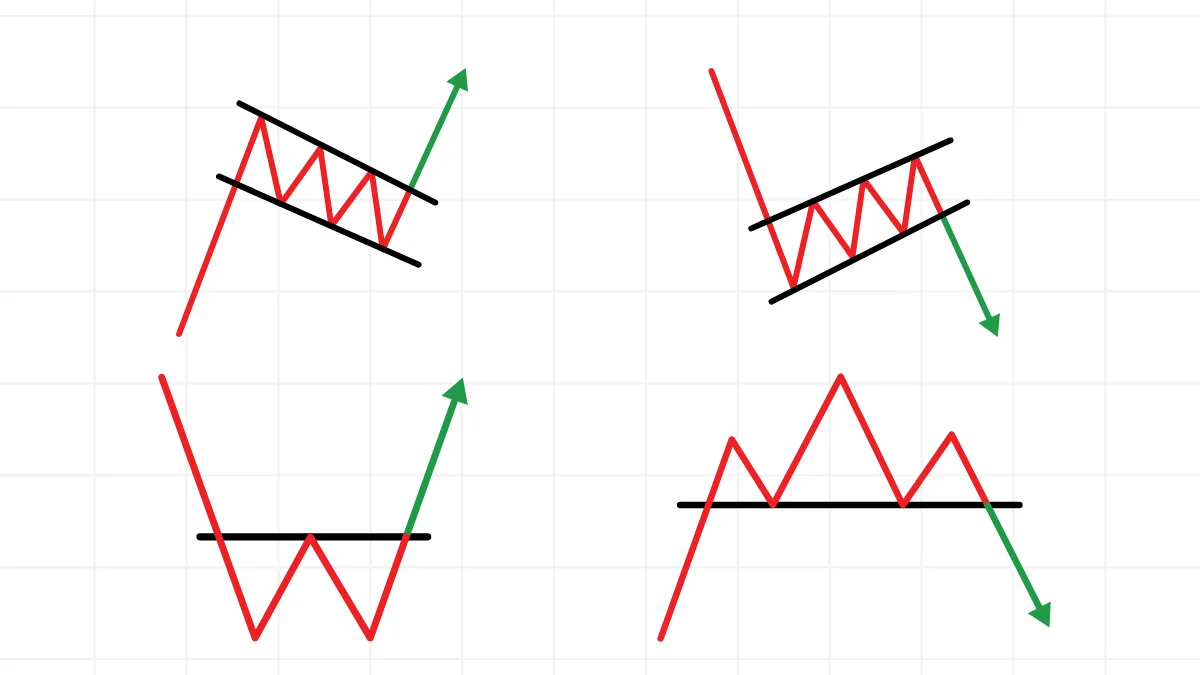
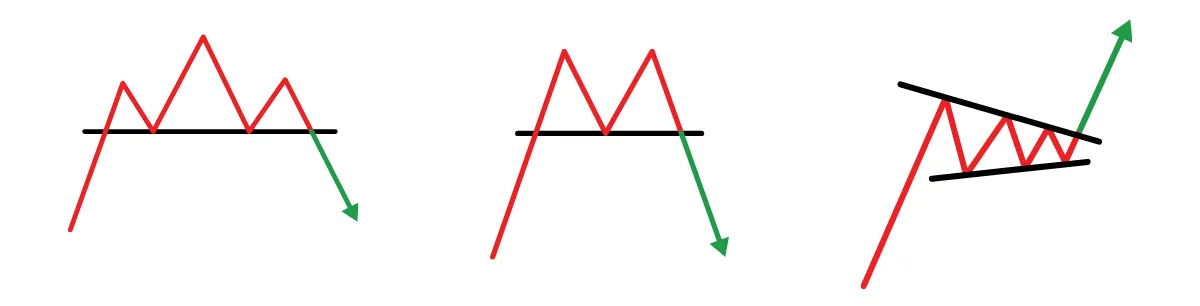
- Chart Patterns: By observing specific geometric shapes formed by price movements on charts, analysts judge whether a trend is likely to continue or reverse. Common examples include Head and Shoulders, Double Top/Bottom, Triangles, Flags, etc.
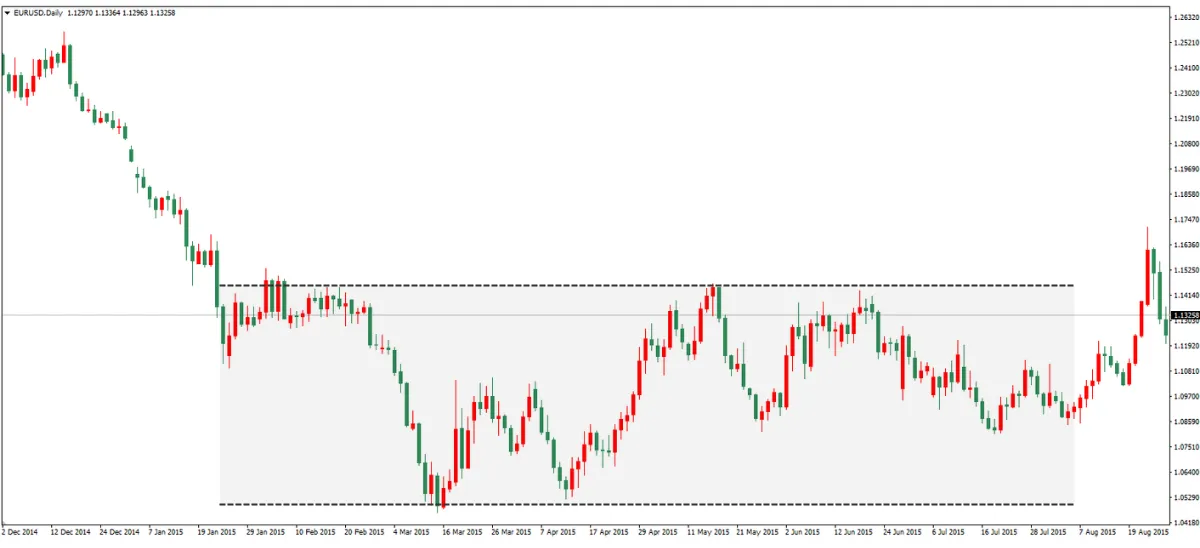
- Trend Lines and Support/Resistance:
- Trend Lines: Connect a series of lows in an uptrend or a series of highs in a downtrend to depict the direction and channel of the trend.
- Support Levels: Areas where buying pressure tends to enter when price falls to a certain level, preventing further decline.
- Resistance Levels: Areas where selling pressure tends to enter when price rises to a certain level, preventing further increase.
- Technical Indicators: These are numerical values calculated from price and/or volume data using mathematical formulas, usually overlaid on the main chart or displayed in subcharts. They provide clues about trend strength, overbought/oversold conditions, momentum changes, etc. Common examples include: Moving Averages (MA) - smooth price fluctuations to help identify trend direction; Relative Strength Index (RSI) - measures price momentum and possible overbought/oversold states; MACD (Moving Average Convergence Divergence) - shows trend direction, strength, and turning points.
Important Note: Technical indicators are just auxiliary tools, not crystal balls. They may lag behind price or give false signals. Usually, multiple tools or signals need to be combined for confirmation.
3. Advantages and Limitations of Technical Analysis
Advantages:- Wide Applicability: Can be applied to almost any market with price charts (forex, stocks, futures, cryptocurrency, etc.) and any time frame.
- Provides Clear Signals: Compared to fundamental analysis, technical analysis often offers more specific potential entry and exit points.
- Intuitive and Easy to Learn (for Beginners): Some basic chart patterns and concepts are relatively easy to learn and recognize visually.
Limitations:
- May Lag: Many indicators are calculated based on historical data, so their signals may appear after significant price changes have already occurred.
- Can Be Misleading: Markets do not always behave as expected; false signals or pattern failures occur frequently.
- Subjectivity Exists: For example, drawing trend lines or identifying certain patterns may vary between analysts.
- Ignores Fundamental Factors: Relying solely on technical analysis may overlook sudden major news or economic data causing fundamental shifts.
4. How Should Beginners Start Learning Technical Analysis?
- Start with Basic Concepts: First, solidly understand core concepts such as: What is a trend? How to identify support and resistance? What is the basic reading of candlestick charts?
- Master a Few Tools: Don’t try to learn dozens of technical indicators at once. Choose one or two of the most commonly used and basic indicators (e.g., moving averages) or concepts (e.g., support and resistance), and deeply understand their principles and usage.
- Practice Reading Charts Extensively: Spend time observing real historical charts on demo trading platforms or charting software. Try drawing trend lines yourself, finding support and resistance levels, and see how prices react.
- Combine with Risk Management: Remember, technical analysis provides probabilities, not certainties. No matter how perfect a technical signal looks, it must be accompanied by strict risk management measures (setting stop-losses, controlling position size).
- Be Patient and Keep Learning: Technical analysis is a skill that requires experience accumulation. It cannot be mastered overnight; maintain enthusiasm and patience for continuous learning.
Conclusion
Technical analysis is a method of predicting future price movements by studying historical market data (mainly price charts).It is based on the core concepts that "market action discounts everything," "prices tend to move in trends," and "history tends to repeat itself."
Common tools include chart patterns, trend lines, support and resistance levels, and various technical indicators.
Technical analysis provides traders with a framework and language to observe the market and find potential trading opportunities.
Although it has advantages (such as wide applicability and providing specific signals), it also has limitations (such as lagging and potential misleading signals).
For beginners, starting from the basics, mastering a few tools, practicing extensively, and always combining with strict risk management is the correct approach to using technical analysis to assist trading.


One Response
This post is genuinely a good one it helps new web users, who are wishing in favor of blogging.