The First Step to a Profitable System: A Deep Dive into the Classic "Trend + Oscillator" Trading Strategy
Quickly learn how to use trend and oscillator indicators to establish fundamental entry and exit rules.
Author: Mr.Forex
Preface: Stop Trading on Gut Feeling
Having mastered Candlestick theory, you can now interpret price movements on a chart, but that alone isn't enough to sustain consistent trading performance.The most common mistake beginners make is trading based on "intuition": shorting because it feels "too high" or trying to catch a bottom because it feels "too low." This lack of clear rules makes long-term profitability difficult and leads to emotional decision-making.
To become a rational trader, you must establish a comprehensive "Trading System."
What is a trading system? Simply put, it is a Standard Operating Procedure (SOP):
Condition A (Trend Direction) + Condition B (Entry Timing) + Condition C (Risk Management) = Execute Trade
This chapter uses two classic indicators—Moving Average (MA) and the Stochastic Oscillator (KD)—to demonstrate how to combine them into a concrete set of trading rules.
Note: This article is for educational purposes only. No indicator is 100% accurate; the core of trading lies in developing rules and strictly following your logic.
Tool 1: Moving Average (MA) — Determining Trend Direction
In the MT5 platform, you can find this under the "Trend" indicators category.
How to Set Up
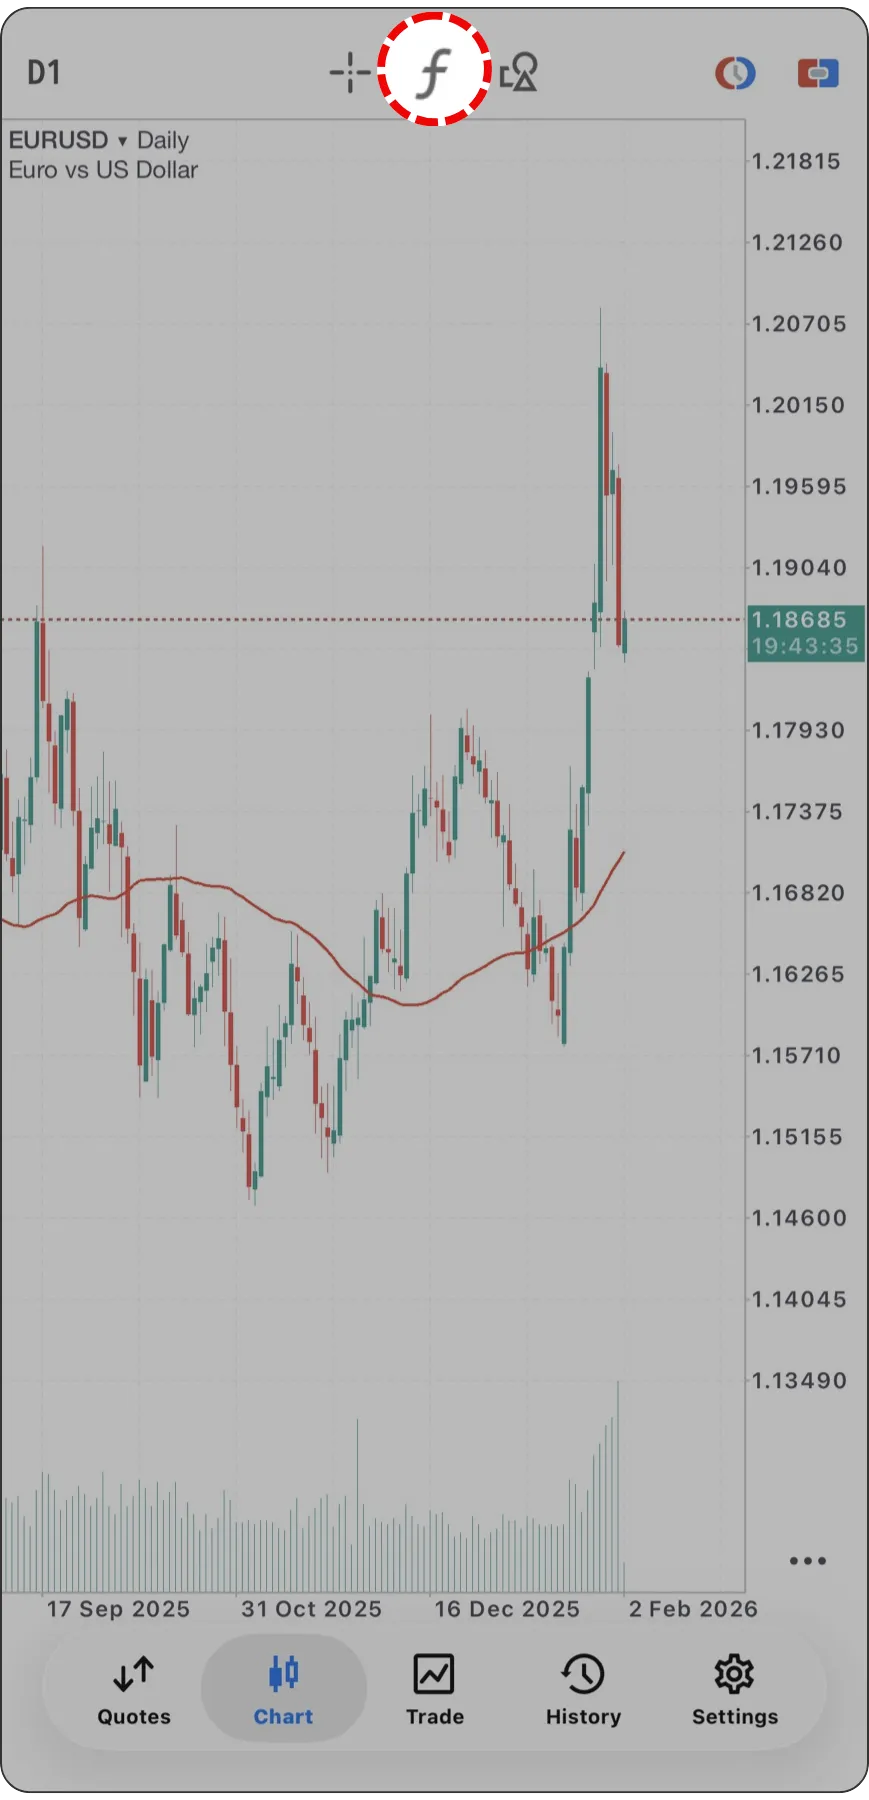
- Open Menu: Tap once on the mobile chart screen and select the "f" icon (Indicator List) at the top.
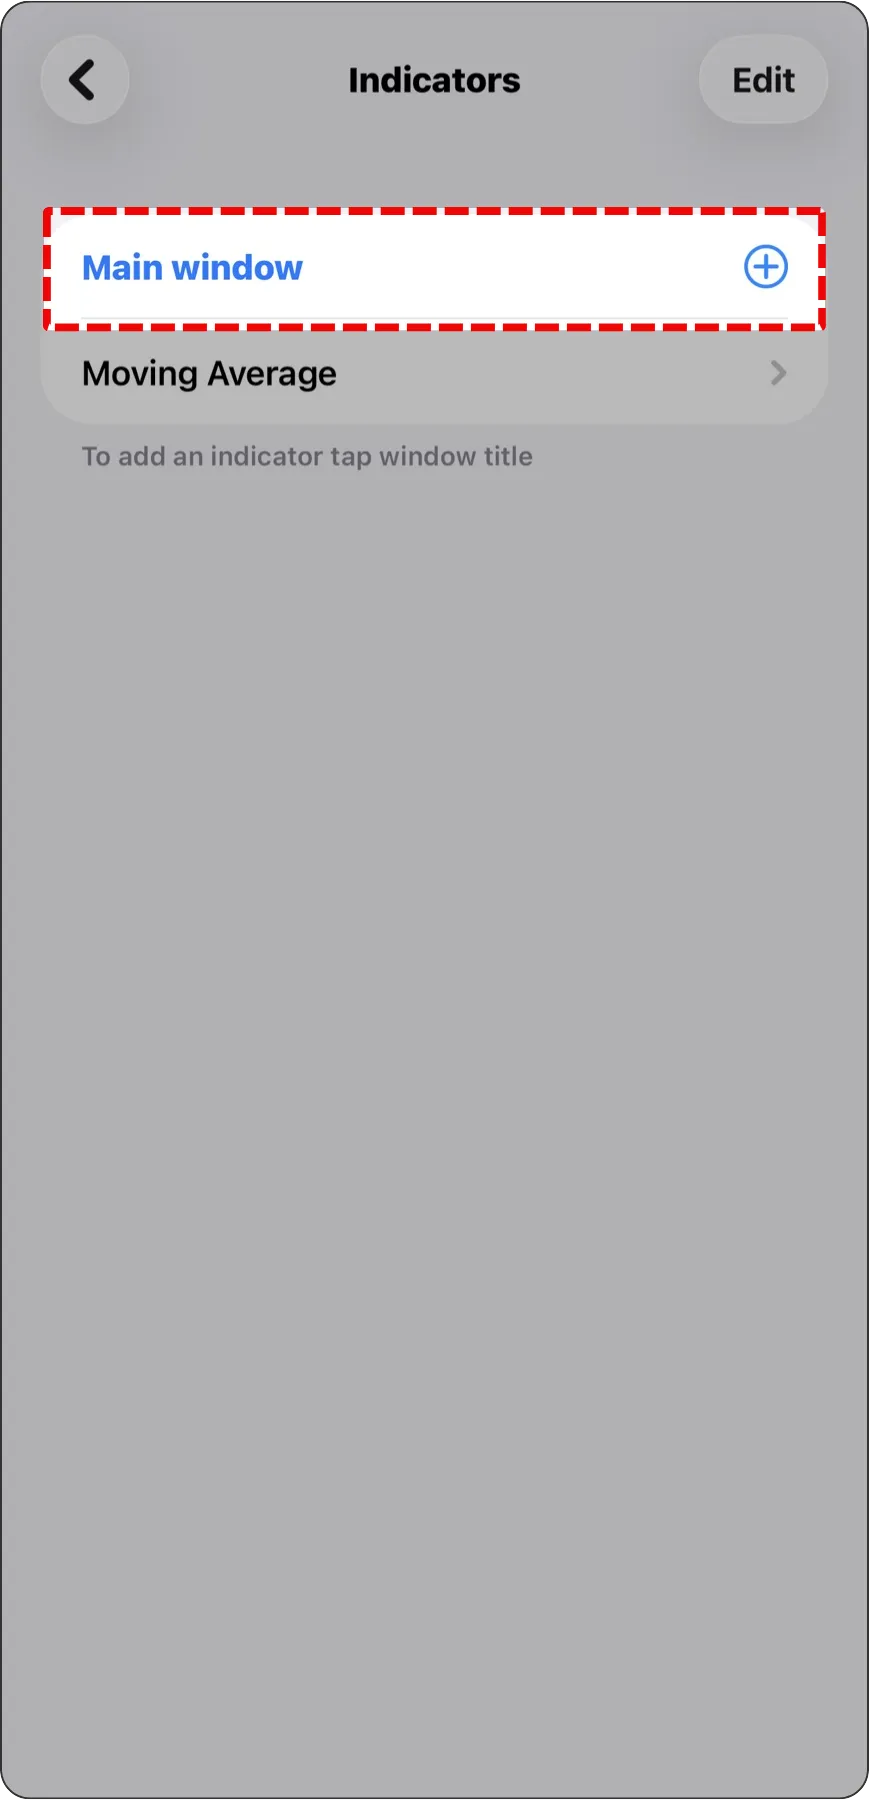
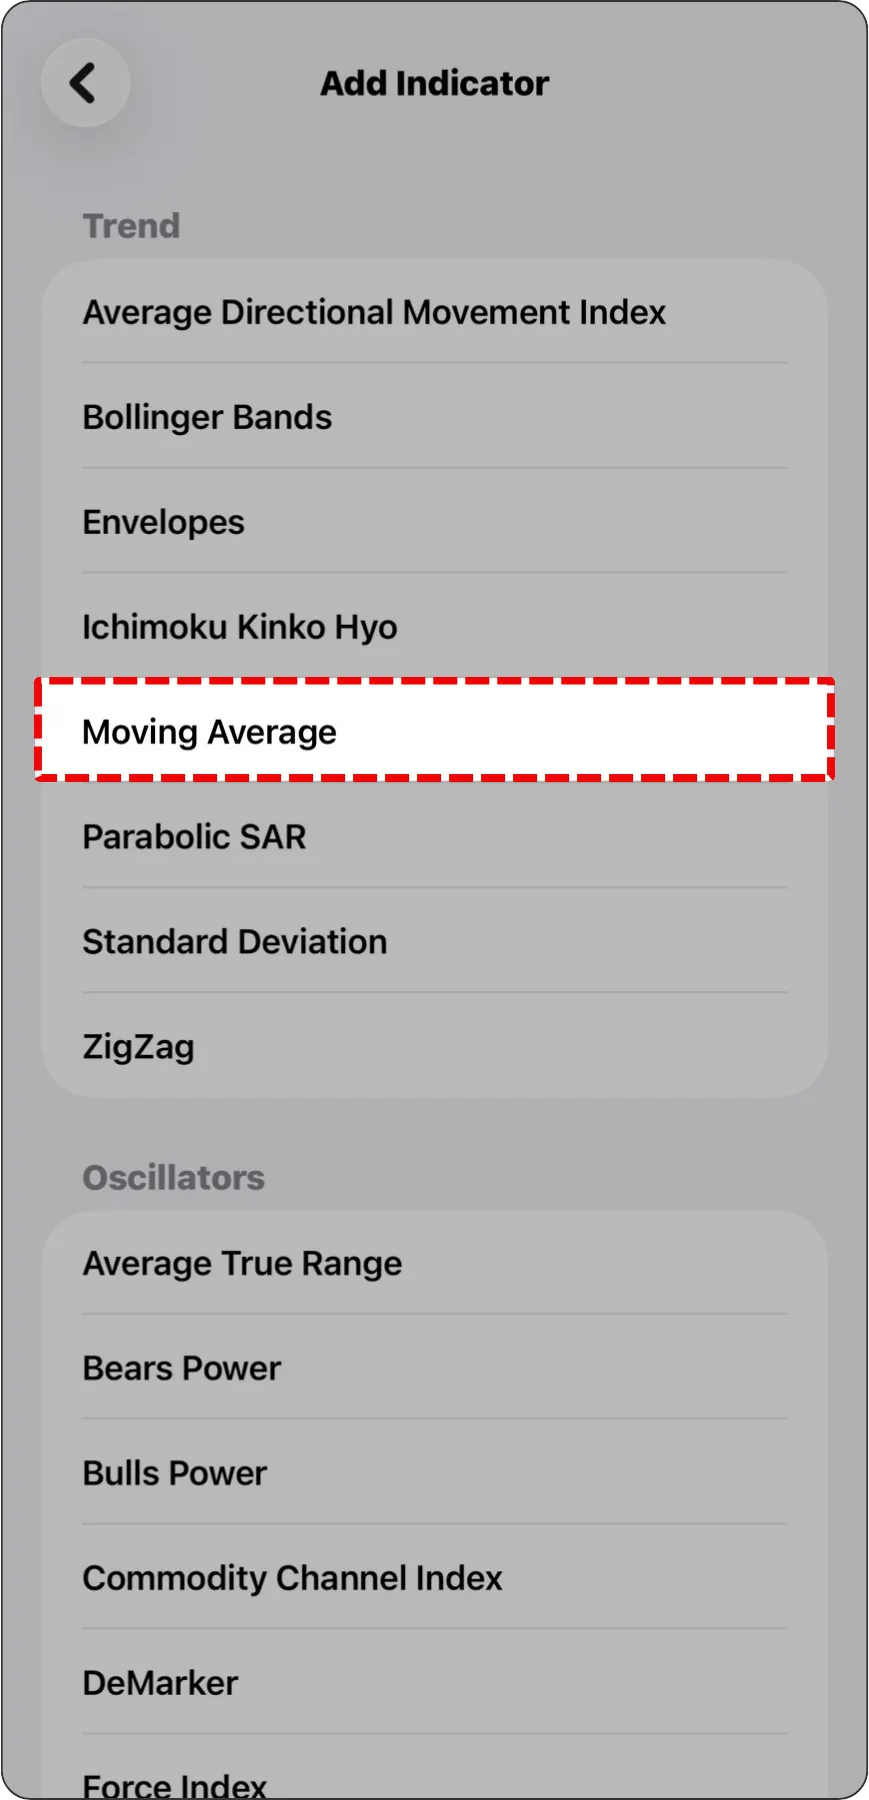
- Select Indicator: Click "Main window" and find "Moving Average" under the "Trend" category.
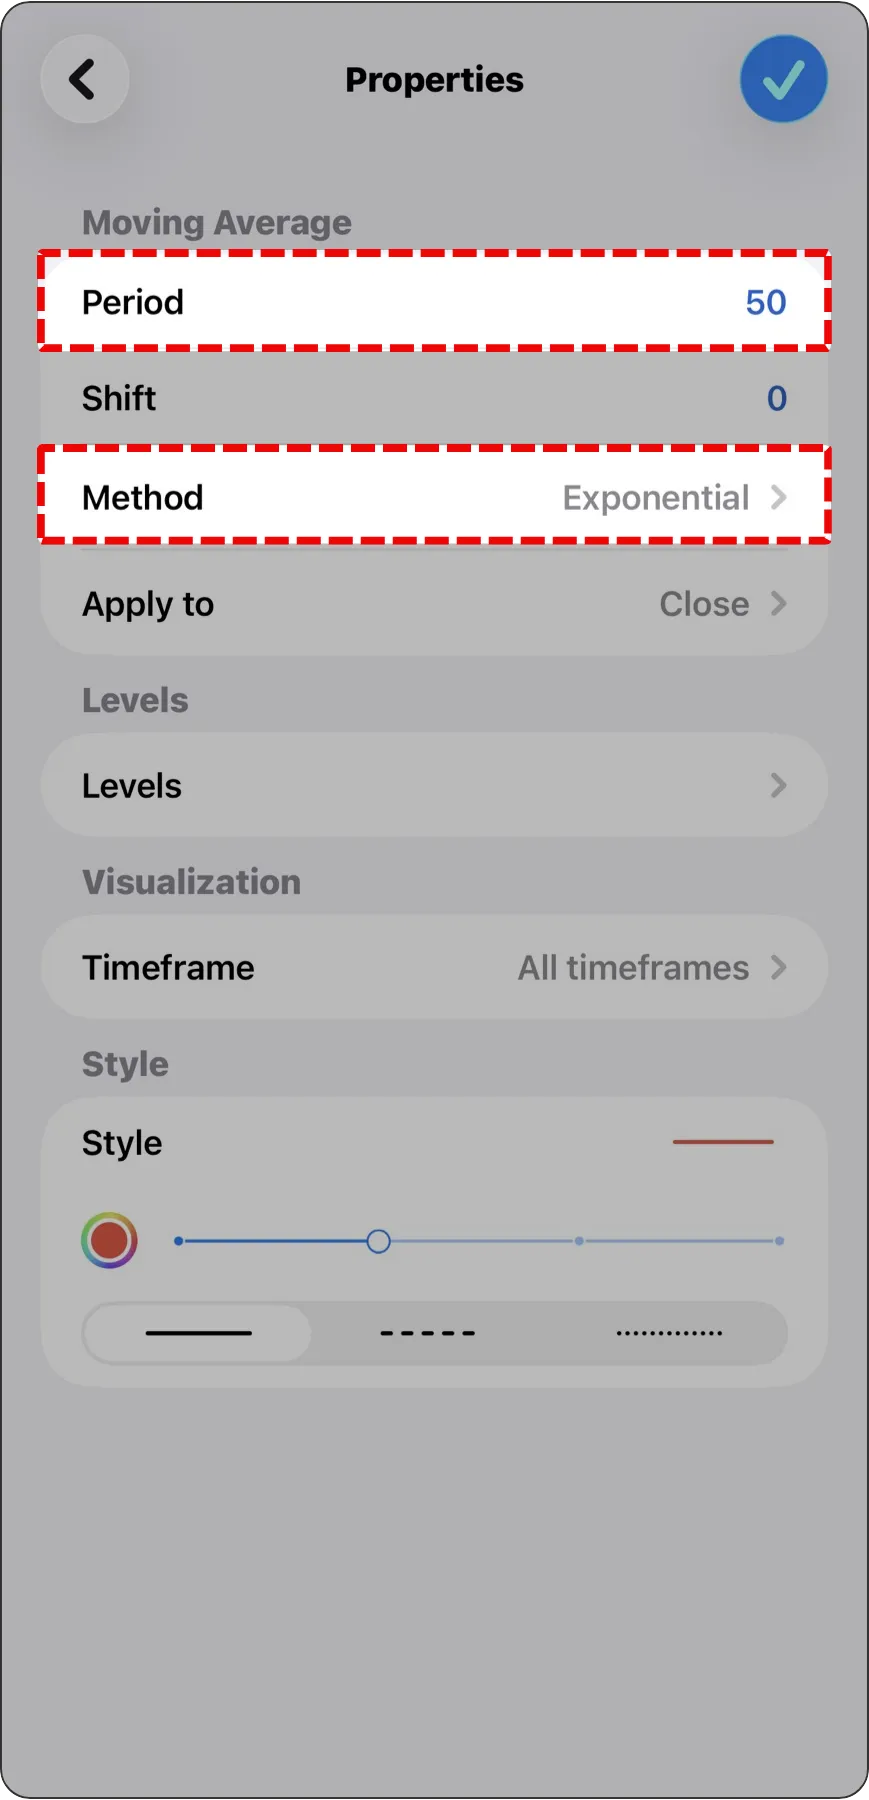
- Configure Parameters:
- Period: It is recommended to set this to 20 or 50 (representing the average cost of the past 20 or 50 candlesticks).
- Style: Choose a vibrant color (like blue or yellow) and set the width to 2 pixels for better visibility.
- Method: For beginners, Simple or Exponential is recommended.
- Finish: Tap "Done" in the top right corner to return to the chart and see your Moving Average.
How to Set Up
- Access Path: From the top menu, click "Insert" > "Indicators" > "Trend" > "Moving Average."
- Parameters Tab:
- Period: Enter 20 or 50.
- Shift: Keep the default value of 0.
- Method: Recommended to choose Simple or Exponential.
- Set Style: Pick a distinct color and line thickness in the "Style" field.
- Finish: Click "OK," and the indicator will appear on your main chart.


1. Definition & Core Logic
The Moving Average (MA) is a curve formed by averaging the closing prices over the past N periods. Its primary role is to "smooth out" price fluctuations, helping traders filter through noise and clearly identify the current trend direction.2. How to Identify a Trend?
The most intuitive method is to observe the relative position between "Price (Candlesticks)" and the "MA":- 📈 Uptrend Zone:
When candlesticks are trading above the MA, and the MA slope is upward.
Trading Logic: Indicates a bullish trend; prioritize looking for "Buy" opportunities. - 📉 Downtrend Zone:
When candlesticks are trading below the MA, and the MA slope is downward.
Trading Logic: Indicates a bearish trend; prioritize looking for "Sell" opportunities.
Mr.Forex Insight: The Moving Average acts like a trend filter, effectively helping us avoid the risks of trading against the market.


Tool 2: Stochastic Oscillator — Pinpointing Your Entry Timing
In MT5, you can find it under the "Oscillators" category. In Chinese-speaking trading communities, it is commonly referred to as the KD Indicator.
How to Set Up
- Open Menu: Tap the "f" icon at the top of the chart again.
- Select Indicator: Choose "Stochastic Oscillator" under the "Oscillators" category.
- Configure Parameters:
- %K Period / %D Period / Slowing: Beginners are advised to keep default values (usually 5, 3, 3).
- Levels: Ensure that 20 and 80 are set (these are crucial for distinguishing Overbought and Oversold conditions).
- Finish: Tap "Done" in the top right; a separate indicator window will appear at the bottom of the chart.


How to Set Up
- Access Path: Click "Insert" > "Indicators" > "Oscillators" > "Stochastic Oscillator."
- Parameters Tab:
- Keep the default values (5, 3, 3) or adjust slightly based on your strategy needs.
- Levels Tab: Crucial Step!
- Click this tab and confirm that 20 and 80 are listed.
- If values are missing, click "Add" to enter them manually. It's recommended to set these lines as dashed lines to keep the chart clean.
- Finish: Click "OK," and the indicator will appear in a separate window below the chart.


1. Indicator Definition
This indicator consists of a fast line (%K) and a slow line (%D), with values ranging between 0 and 100. It reflects relative price strength over a specific period, helping to judge if the market is "overheating."2. Key Signal Interpretation
- 🔥 Overbought Zone:
When the value is above 80, it indicates excessive buying momentum; the price could experience a pullback at any time. - ❄️ Oversold Zone:
When the value is below 20, it indicates excessive selling pressure; the price could bounce back at any time.
3. Entry Crossover Signals
- Golden Cross:
In the Oversold zone (below 20), when the fast line (%K) crosses above the slow line (%D), it is generally considered a Buy signal. - Death Cross:
In the Overbought zone (above 80), when the fast line (%K) crosses below the slow line (%D), it is generally considered a Sell signal.

Practical Application: Your First Trading SOP
Using MA or KD alone has limitations: MAs are lagging, while KD can produce false signals. Combining them creates synergy—the core of "Trend Following": Buying on pullbacks in an uptrend, and selling on rallies in a downtrend.Scenario A: Long Setup (Buy)
- Confirm Trend (MA): Candlesticks are trading above the MA, and the MA is sloping upward.
- Wait for Pullback (KD): Avoid chasing highs; wait patiently for the KD indicator to drop into the Oversold zone near 20.
- Signal Confirmation: Look for a Golden Cross in the KD at these low levels.
- Execute Trade: Execute a "Buy" order.

Scenario B: Short Setup (Sell)
- Confirm Trend (MA): Candlesticks are trading below the MA, and the MA is sloping downward.
- Wait for Rally (KD): Avoid selling at the very bottom; wait patiently for the KD indicator to rise into the Overbought zone near 80.
- Signal Confirmation: Look for a Death Cross in the KD at these high levels.
- Execute Trade: Execute a "Sell" order.

Risk Management: Stop Loss & Take Profit (SL & TP)
No strategy guarantees 100% profit. When market movement defies expectations, we must cut losses decisively to ensure capital safety. This is the essence of "survival."Recommended Settings:
Stop Loss (SL):When Long: Set below the recent swing low. Avoid placing it exactly on round numbers to allow for market noise.
When Short: Set above the recent swing high.
Purpose: If the price hits this level, it signals that the original trend assumption has likely changed, and you must exit to preserve capital.

Take Profit (TP):
We recommend introducing the "Risk-Reward Ratio" concept.
If you take a 10-pip stop loss risk, your profit target should be at least 15 to 20 pips (i.e., 1:1.5 or 1:2).
Purpose: This ensures that even with a 50% win rate, your account maintains a positive expected value in the long run.
We recommend introducing the "Risk-Reward Ratio" concept.
If you take a 10-pip stop loss risk, your profit target should be at least 15 to 20 pips (i.e., 1:1.5 or 1:2).
Purpose: This ensures that even with a 50% win rate, your account maintains a positive expected value in the long run.

Conclusion: Just the Start of Your Trading Journey
Through this chapter, you have mastered the three pillars of rule-building: "Trend + Timing + Risk Control."We suggest practicing repeatedly in a demo account first. In real-market operations, you will observe true challenges:
- During consolidation periods, the MA may be crossed frequently, generating false signals.
- In strong trends, the KD indicator may stay "embedded" for a long time (remaining above 80 or below 20).
This is the reality of manual trading—beyond understanding indicators, you must sharpen your market intuition and overcome psychological weaknesses.
However, even with a perfect strategy, failing to control your trade size (Position Sizing) can lead to account liquidation during unexpected market volatility.
To make this SOP truly powerful, you must build your ultimate line of defense. This is exactly what we will explore in the next chapter: