Forex Technical Indicator: Usage and Interpretation of Bollinger Bands
Following Moving Average (MA), Relative Strength Index (RSI), and MACD, "Bollinger Bands" is another commonly used technical indicator you are likely to see on many traders' charts.It was invented by John Bollinger in the 1980s and appears as a dynamic "channel" formed around the price chart.
The main function of Bollinger Bands is to help traders measure market volatility and assess whether the current price is relatively high or low compared to its recent average level.
Understanding the composition and common uses of Bollinger Bands can add a powerful tool to your technical analysis toolbox.
This article will briefly introduce what the three lines of Bollinger Bands are, how to observe market volatility through them, and key points to watch out for when using them.
1. The Three Lines of Bollinger Bands: Middle Band, Upper Band, and Lower Band
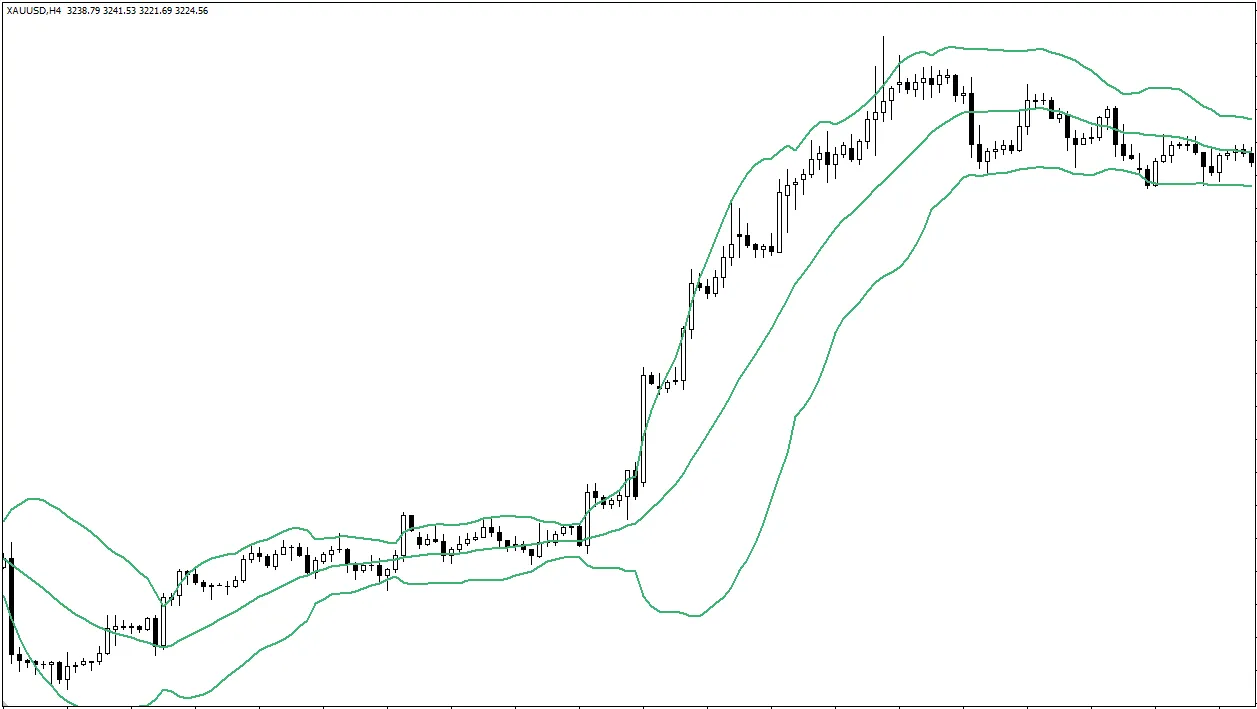
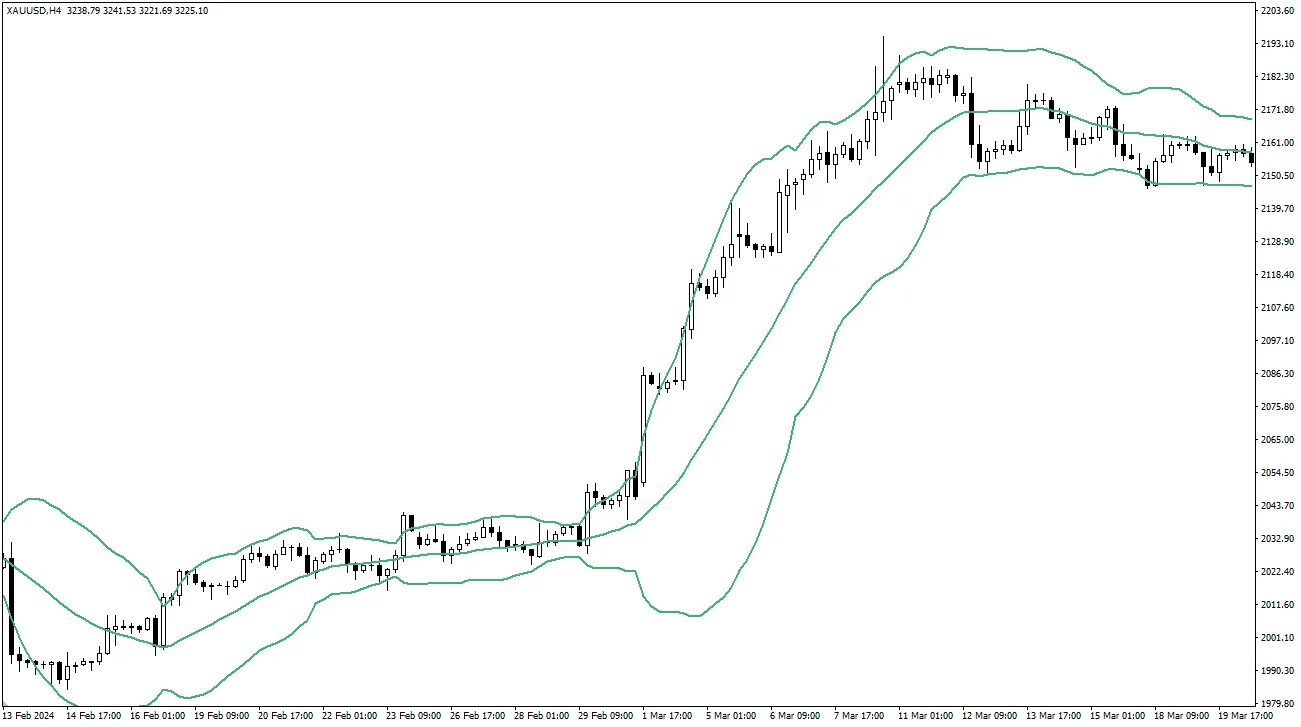
Bollinger Bands consist of three lines that together form a channel around price fluctuations:- Middle Band: This line is actually a Simple Moving Average (SMA). The most commonly used period setting is 20 periods. It represents the average cost or trend center of the price over a recent period.
- Upper Band: Calculated by adding a specific multiple of the Standard Deviation to the Middle Band (SMA) value.
- Lower Band: Calculated by subtracting the same multiple of the Standard Deviation from the Middle Band (SMA) value.
What is "Standard Deviation"? (Simple Understanding)
You don't need to delve into complex mathematical formulas.
Just know that "Standard Deviation" is a measure of data dispersion.
Here, it measures the extent of price fluctuations over a past period (the same period as the Middle Band SMA, usually 20 periods) relative to its average value (Middle Band SMA).
- High price volatility -> Larger standard deviation value.
- Low price volatility -> Smaller standard deviation value.
The Upper and Lower Bands are usually plotted as Middle Band ± 2 standard deviations.
2. Channel Width: The "Barometer" of Market Volatility
One of the most intuitive and useful functions of Bollinger Bands is to judge market volatility by observing the distance between the Upper and Lower Bands (i.e., the channel width):- Bands Widen: When the distance between the Upper and Lower Bands significantly expands, it indicates increasing market volatility and larger price swings.
- Bands Narrow / Squeeze: When the distance between the Upper and Lower Bands becomes very close and the channel narrows (known as "Bollinger Band Squeeze" or Squeeze), it indicates decreasing market volatility and that the price has entered a relatively calm consolidation phase.
 By observing changes in channel width, traders can visually understand the current market activity level.
3. Common Uses and Interpretations of Bollinger Bands (Use with Caution!)
Traders use Bollinger Bands to find potential trading clues, but the following uses require great caution and should never be applied mechanically:- As a Reference for Relative Highs and Lows:
- Price touches the Upper Band: Indicates the current price is relatively high compared to its recent average and volatility range. Some consider this a potential "overbought" signal.
- Price touches the Lower Band: Indicates the current price is relatively low compared to its recent average and volatility range. Some consider this a potential "oversold" signal.
Touching the upper or lower Bollinger Band ≠ price will definitely reverse! This is the most common mistake made by beginners!
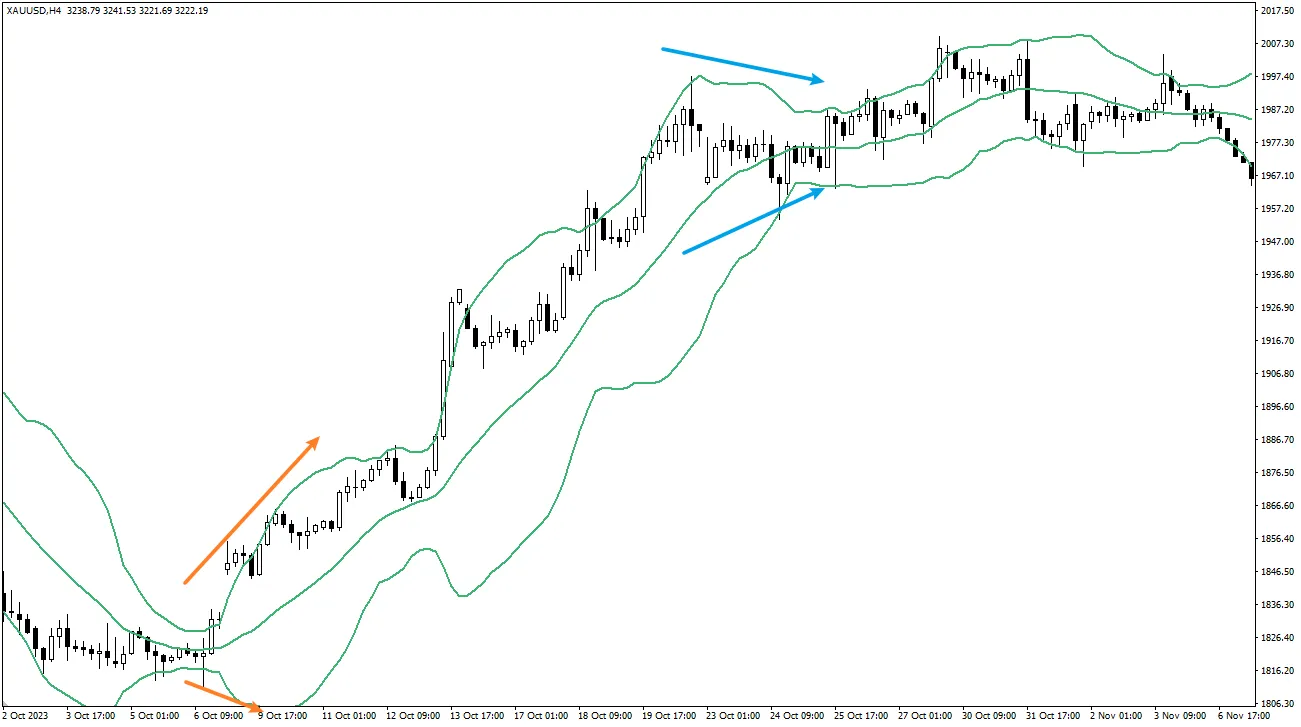
In a strong uptrend, the price can continuously touch or even "walk the band" along the upper band, making new highs.
Similarly, in a strong downtrend, the price can continuously touch or walk along the lower band.
Simply shorting because the price hits the upper band or going long because it hits the lower band, especially against the main trend, is extremely risky! You must combine other analyses (such as candlestick patterns, trend confirmation, support and resistance) to make judgments. - Volatility Breakout Signal: "Bollinger Band Squeeze" (The Squeeze):
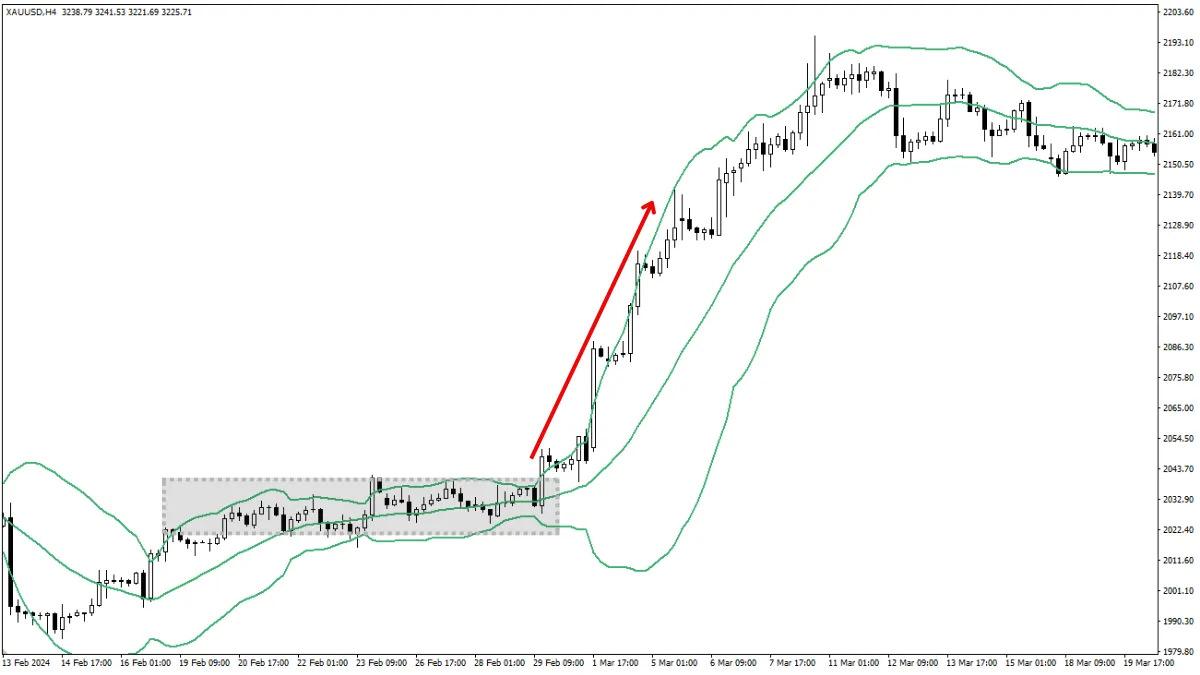
- Phenomenon: When the Bollinger Bands narrow to a very tight range (low volatility), it usually signals that the market is accumulating energy and a large volatility move (high volatility) may erupt soon.
- Potential Use: Traders closely watch the breakout direction after the "squeeze." A strong breakout above the upper band may signal the start of an uptrend; a breakout below the lower band may signal the start of a downtrend.
 Note: The "squeeze" itself does not indicate breakout direction. Breakouts can also be false. Wait for clear breakout signals and set proper risk controls.
- Assisting Trend Judgment: Observing which area of the channel the price mainly operates in can help judge the trend. For example, in a strong uptrend, the price may mostly run between the Middle and Upper Bands.
4. Limitations of Bollinger Bands
- Not a Standalone Trading System: Signals provided by Bollinger Bands (such as touching bands or squeeze breakouts) are insufficient for complete trading decisions and must be confirmed with other analysis tools and methods.
- Lagging Indicator: It is based on moving averages and historical volatility, so its response always lags behind actual price movements.
- Does Not Directly Predict Direction: Bollinger Bands mainly tell you the relative position of price and the size of volatility but cannot clearly predict which direction the price will move next (especially during squeeze conditions).
5. Are Bollinger Bands Suitable for Beginners?
- Good Visual Effect: Bollinger Bands present volatility and relative price position in a very intuitive "channel" form, making it easier for beginners to observe and understand.
- Easy to Misuse: The main risk for beginners is equating touching the bands simply with reversal signals, leading to dangerous counter-trend trades.
Recommendations:
- Bollinger Bands are a useful indicator for beginners to help understand the concept of volatility and relative price highs and lows.
- Start by Observing: Add Bollinger Bands to charts in a Demo Account (using default 20-period SMA and 2 standard deviation settings). Carefully observe how channel width changes with market volatility. How does price interact with the three lines? How does price "walk the band" during strong trends?
- Understand the Concept of "Relative": Remember that the "overbought/oversold" defined by Bollinger Bands is relative to recent prices, unlike RSI which has fixed 70/30 levels.
- Combining with Trend is Key: Always consider Bollinger Band signals within the context of the main market trend! For example, in an uptrend, a price pullback touching the Lower or Middle Band followed by a bullish candlestick pattern may be a potential trend-following buy opportunity. In a downtrend, a price rebound touching the Upper or Middle Band followed by a bearish candlestick pattern may be a potential trend-following sell opportunity. Avoid shorting just because price hits the Upper Band in a strong uptrend.
- Be Cautious with "Squeeze" Breakouts: Squeeze signals potential increased volatility, but wait for clear and strong price breakouts beyond the channel boundaries, preferably confirmed by other signals, before acting.
- Use as an Auxiliary Tool: Treat Bollinger Bands as part of your analysis toolbox, combined with trendlines, support and resistance levels, candlestick patterns, etc., for mutual confirmation.
Conclusion
Bollinger Bands consist of a moving average line (Middle Band) and Upper and Lower Bands calculated based on standard deviation.They intuitively display market volatility (through channel width) and the relative high or low position of price compared to recent averages (through the relationship between price and the bands).
Their most common uses include assessing volatility, identifying potential relative overbought and oversold areas (but not direct reversal signals!), and spotting potential breakout opportunities after a "Bollinger Band Squeeze."
For beginners, Bollinger Bands are a valuable learning tool but require a deep understanding of their limitations, especially not to simply treat touching the bands as reversal signals. Always combine with market trends and other analysis methods for comprehensive judgment and proper risk management.