In the world of foreign exchange margin trading, risk management is always a topic that every trader must face. Among the many risk measurement tools, "max drawdown (Maximum Drawdown, MDD) " is undoubtedly the most noteworthy indicator. This article will delve into the definition of max drawdown, calculation methods, importance, and how to effectively apply it in actual trading, helping you master this core concept and enhance trading stability and capital management capabilities.
Formula:
Max drawdown (%) = (Capital Peak Value - Capital Trough Value) / Capital Peak Value × 100%
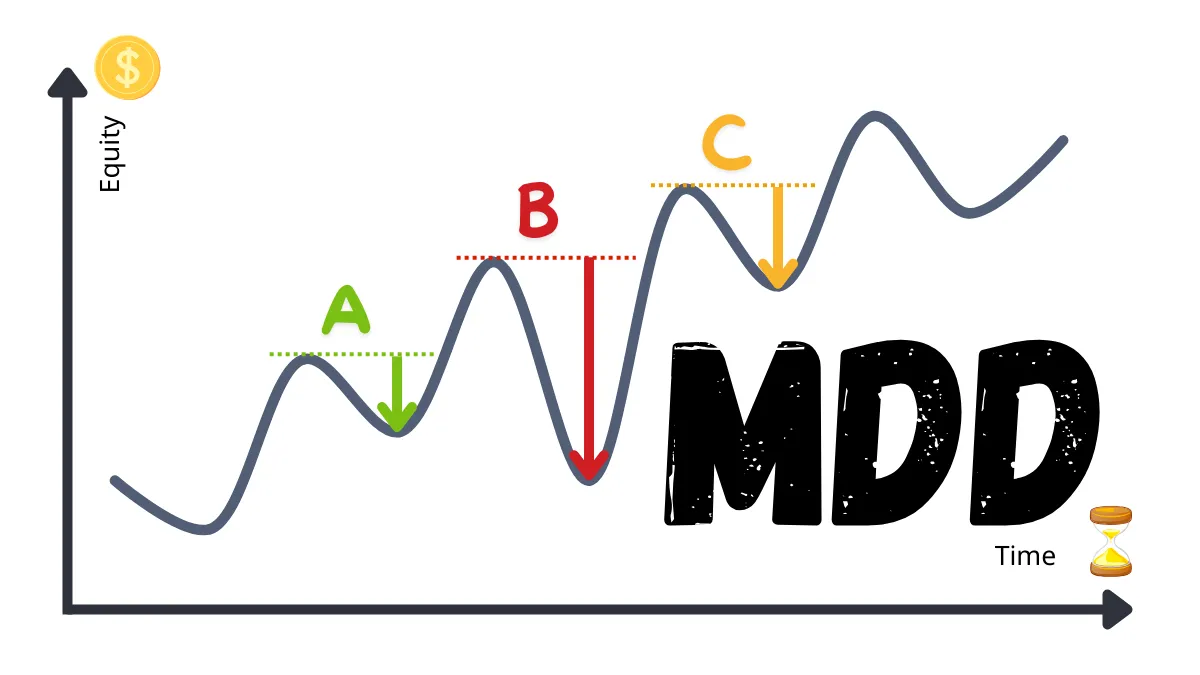
Phase A:
Increased from $10,000 to $12,000 (peak), then fell back to $11,000.
(12,000 − 11,000) / 12,000 × 100% = 8.33%
Phase B:
Increased from $11,000 to $15,000 (peak), then fell back to $9,000.
(15,000 − 9,000) / 15,000 × 100% = 40%
Phase C:
Increased from $9,000 to $17,000 (peak), then fell back to $15,000.
(17,000 − 15,000) / 17,000 × 100% = 11.76%
Among these three drawdown phases, the drawdown in "Phase B" reached 40%, which is the largest drawdown of the three, making B the max drawdown.
If you want to learn more about risk management knowledge or strategies in foreign exchange trading, feel free to follow our more content!
The reasonable range of max drawdown depends on the trader's risk tolerance and trading strategy. Generally, a conservative strategy's max drawdown is usually between 10% - 20%, while an aggressive strategy may reach 30% - 50%. However, a drawdown exceeding 50% is usually considered too risky and may lead to the trading account being unable to recover.
2. What is the difference between max drawdown and loss?
Loss refers to the reduction of capital in a single trade or over a specific period, while max drawdown is the maximum decline of the capital curve over the entire trading history, serving as an important indicator of long-term risk.
3. How to effectively control max drawdown?
4. Is max drawdown applicable to all types of trading strategies?
Yes, max drawdown is applicable to most trading strategies, whether day trading, swing trading, or long-term investing. However, different types of strategies will have different drawdown standards. For example, the drawdown for swing trading may be higher than for high-frequency trading, but still within the normal fluctuation range of the strategy.
5. How to use max drawdown data to improve trading strategies?
6. How to use max drawdown in conjunction with other indicators (such as Sharpe Ratio) ?
Max drawdown reflects risk, while the Sharpe Ratio measures risk-adjusted returns. Combining the two can help traders find strategies that are both robust and efficient. For example, at the same drawdown level, strategies with a higher Sharpe Ratio are more desirable.
7. Do beginners need to pay special attention to max drawdown?
Yes, beginners especially need to pay attention to max drawdown. It can help newcomers establish a correct risk management mindset and avoid losing trading confidence or capital due to excessive losses.
8. Are there tools available to help calculate max drawdown?
Most trading platforms (such as MetaTrader 4/5) have built-in drawdown analysis tools. Additionally, professional trading software and backtesting tools can also automatically generate max drawdown data for traders' reference.
Definition of max drawdown: Your capital stability test
Max drawdown refers to the maximum percentage loss of a trading account's capital curve from its peak to its trough over a specific period. In simple terms, it reflects the worst-case capital loss situation during the trading process.Formula:
Max drawdown (%) = (Capital Peak Value - Capital Trough Value) / Capital Peak Value × 100%
Example of max drawdown
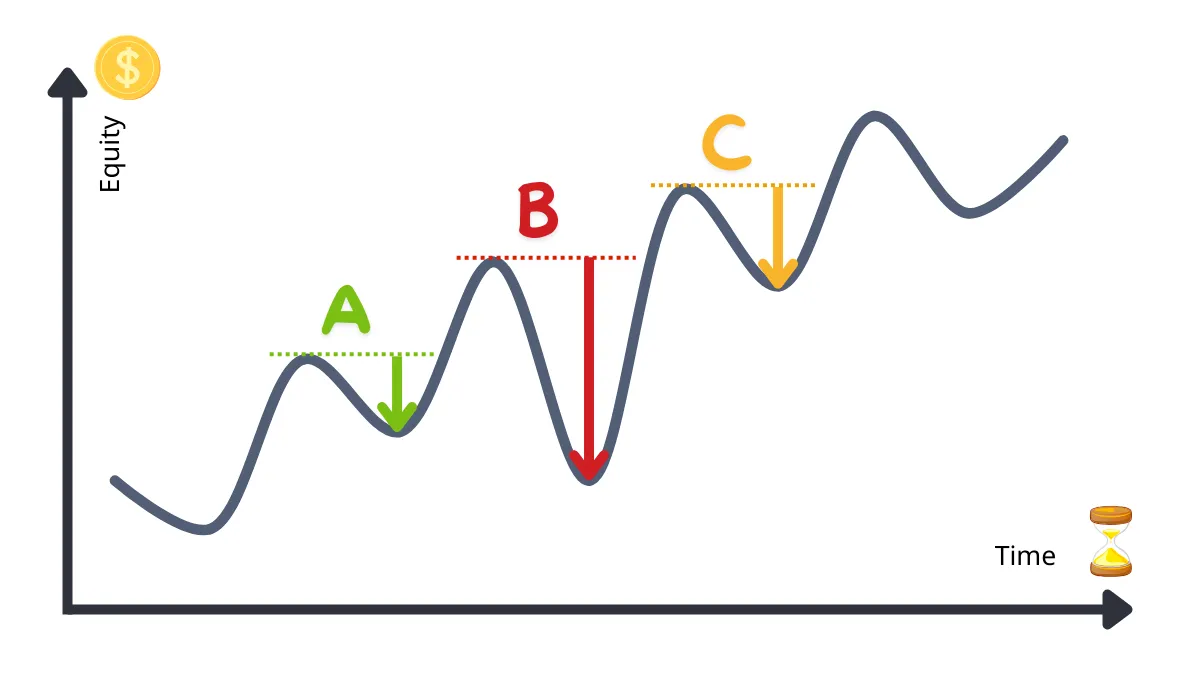
Assuming your account capital experienced three drawdown phases over a certain period:Phase A:
Increased from $10,000 to $12,000 (peak), then fell back to $11,000.
(12,000 − 11,000) / 12,000 × 100% = 8.33%
Phase B:
Increased from $11,000 to $15,000 (peak), then fell back to $9,000.
(15,000 − 9,000) / 15,000 × 100% = 40%
Phase C:
Increased from $9,000 to $17,000 (peak), then fell back to $15,000.
(17,000 − 15,000) / 17,000 × 100% = 11.76%
Among these three drawdown phases, the drawdown in "Phase B" reached 40%, which is the largest drawdown of the three, making B the max drawdown.
In the image, A, B, and C are all "drawdowns."
Among them, the largest amplitude of B is called "max drawdown (Max Drawdown) "
Why is max drawdown crucial?
1. Quantifying risk tolerance
Max drawdown can intuitively tell you how much loss the account may face in the worst-case scenario. For high leverage markets like foreign exchange margin trading, understanding the size of drawdown helps avoid excessive risk-taking.2. Evaluating strategy stability
When selecting or optimizing trading strategies, max drawdown is an important indicator of stability. Even if a strategy is highly profitable, a large drawdown may lead traders to exit prematurely due to psychological pressure.3. Helping to set reasonable goals
By analyzing past max drawdown data, traders can set realistic profit targets and risk limits for the future, making trading plans more executable.Comparison of max drawdown with other risk indicators
| Indicator | Definition | Function |
|---|---|---|
| max drawdown | Maximum decline from peak to trough | Measures the risk tolerance of a strategy |
| Sharpe Ratio | Average return per unit of risk | Evaluates risk-adjusted returns |
| Profit and Loss Ratio | Ratio of average profit from winning trades to average loss from losing trades | Used to examine the risk-reward ratio of trading strategies |
| Win Rate | Percentage of profitable trades out of total trades | Evaluates the success probability of a strategy |
How to reduce max drawdown?
1. Implement strict stop-loss mechanisms
Setting reasonable stop-loss levels can effectively limit losses on individual trades and prevent excessive fluctuations in the capital curve.2. Diversify risk
Do not concentrate all capital on a single currency pair or strategy; diversifying investments can effectively reduce systemic risk.3. Reduce leverage ratio
While high leverage can amplify profits, it also magnifies losses. Appropriately reducing the leverage ratio helps to decrease drawdown.4. Backtest and optimize trading strategies
By backtesting historical data, you can examine the performance of strategies under different market conditions and optimize accordingly to reduce potential drawdown.Conclusion: Max drawdown is the cornerstone of risk management
In foreign exchange margin trading, mastering max drawdown not only allows you to gain a deeper understanding of the potential risks of strategies but also helps you formulate more robust trading plans. Remember, successful trading is not just about pursuing profits, but also about learning how to control losses.If you want to learn more about risk management knowledge or strategies in foreign exchange trading, feel free to follow our more content!
Common Questions about max drawdown (FAQ)
1. What is a reasonable range for max drawdown?The reasonable range of max drawdown depends on the trader's risk tolerance and trading strategy. Generally, a conservative strategy's max drawdown is usually between 10% - 20%, while an aggressive strategy may reach 30% - 50%. However, a drawdown exceeding 50% is usually considered too risky and may lead to the trading account being unable to recover.
2. What is the difference between max drawdown and loss?
Loss refers to the reduction of capital in a single trade or over a specific period, while max drawdown is the maximum decline of the capital curve over the entire trading history, serving as an important indicator of long-term risk.
3. How to effectively control max drawdown?
- Use strict stop-loss levels to limit losses.
- Diversify investments to avoid concentrated risks.
- Avoid excessive use of leverage.
- Examine the stability of strategies through backtesting and simulated trading.
4. Is max drawdown applicable to all types of trading strategies?
Yes, max drawdown is applicable to most trading strategies, whether day trading, swing trading, or long-term investing. However, different types of strategies will have different drawdown standards. For example, the drawdown for swing trading may be higher than for high-frequency trading, but still within the normal fluctuation range of the strategy.
5. How to use max drawdown data to improve trading strategies?
- If max drawdown is too high, check for excessive leverage or lack of stop-loss.
- Backtest historical data to find more robust entry and exit points.
- Analyze market conditions during drawdown to find inspiration for improving strategies.
6. How to use max drawdown in conjunction with other indicators (such as Sharpe Ratio) ?
Max drawdown reflects risk, while the Sharpe Ratio measures risk-adjusted returns. Combining the two can help traders find strategies that are both robust and efficient. For example, at the same drawdown level, strategies with a higher Sharpe Ratio are more desirable.
7. Do beginners need to pay special attention to max drawdown?
Yes, beginners especially need to pay attention to max drawdown. It can help newcomers establish a correct risk management mindset and avoid losing trading confidence or capital due to excessive losses.
8. Are there tools available to help calculate max drawdown?
Most trading platforms (such as MetaTrader 4/5) have built-in drawdown analysis tools. Additionally, professional trading software and backtesting tools can also automatically generate max drawdown data for traders' reference.