What is Technical Analysis?
Technical Analysis is a widely used trading method in the foreign exchange, stock, futures, and other markets. It predicts future price trends by analyzing past price data, trading volume, and other market data. The core idea of technical analysis is that patterns and trends are embedded in the historical data of the market, which help traders forecast future price changes.1. Basic Assumptions of Technical Analysis
Technical analysis relies on three main basic assumptions:- Price Reflects Everything: This means that all factors that may affect the market (including economic, political, psychological, etc.) are already reflected in the price. Therefore, technical analysis only needs to focus on price movements themselves, without delving into the underlying reasons.
- Price Follows Trends: Technical analysis believes that market prices usually move along certain trends, whether they are upward, downward, or sideways. Therefore, identifying and following these trends is the core of technical analysis.
- History Repeats Itself: Technical analysis is based on historical data, believing that price behavior will repeat, especially when market sentiment and behavior patterns are similar. Therefore, past market patterns can provide clues for future price trends.
2. Main Tools of Technical Analysis
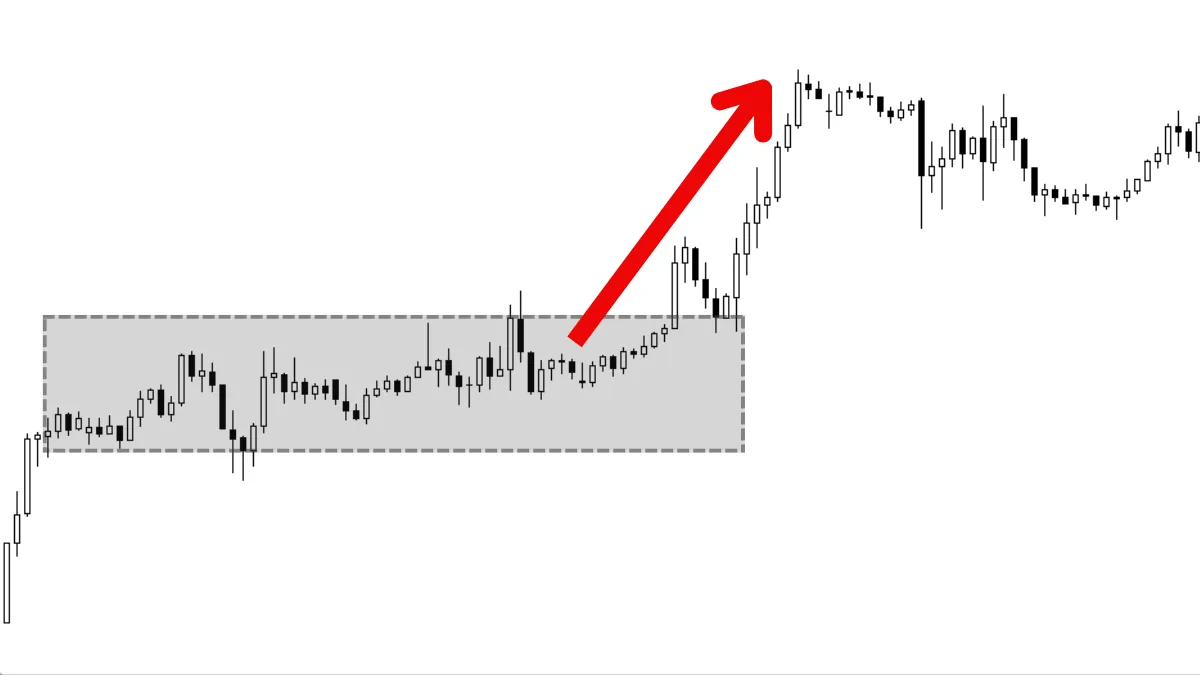
There are many tools and indicators in technical analysis that can help traders identify market trends and trading signals. Here are some common technical analysis tools:- Trendlines: Trendlines are one of the simplest but effective tools in technical analysis. By connecting the highs or lows of prices, trendlines can help traders identify upward or downward price trends.
- Moving Averages (MA): Moving averages average the prices over a certain period to eliminate short-term price fluctuations, helping traders see price trends more clearly. Common moving averages include Simple Moving Average (SMA) and Exponential Moving Average (EMA).
- Support and Resistance: Support levels are areas where prices find it difficult to fall, while resistance levels are areas where prices find it difficult to rise. These areas are often focal points for market participants, and prices tend to reverse when approaching these areas.
- Relative Strength Index (RSI): RSI is a momentum indicator used to measure the speed and magnitude of price changes. When the RSI value exceeds 70, it indicates that the market may be overbought; when the RSI value falls below 30, it indicates that the market may be oversold.
- Bollinger Bands: Bollinger Bands consist of three lines, with the middle line being the moving average, and the upper and lower lines being the standard deviations of that moving average. Bollinger Bands can be used to measure market volatility, and when prices touch the upper or lower bands, it often indicates that the market may reverse.
3. Applications of Technical Analysis
Technical analysis is particularly suitable for short-term and intraday traders, as it relies on price charts and indicators to find immediate trading opportunities. Traders typically use technical analysis to identify entry and exit points and set stop-loss and target price levels. Additionally, technical analysis can also be used to identify long-term market trends and turning points, helping traders decide whether to hold or reverse their positions.4. Advantages and Disadvantages of Technical Analysis
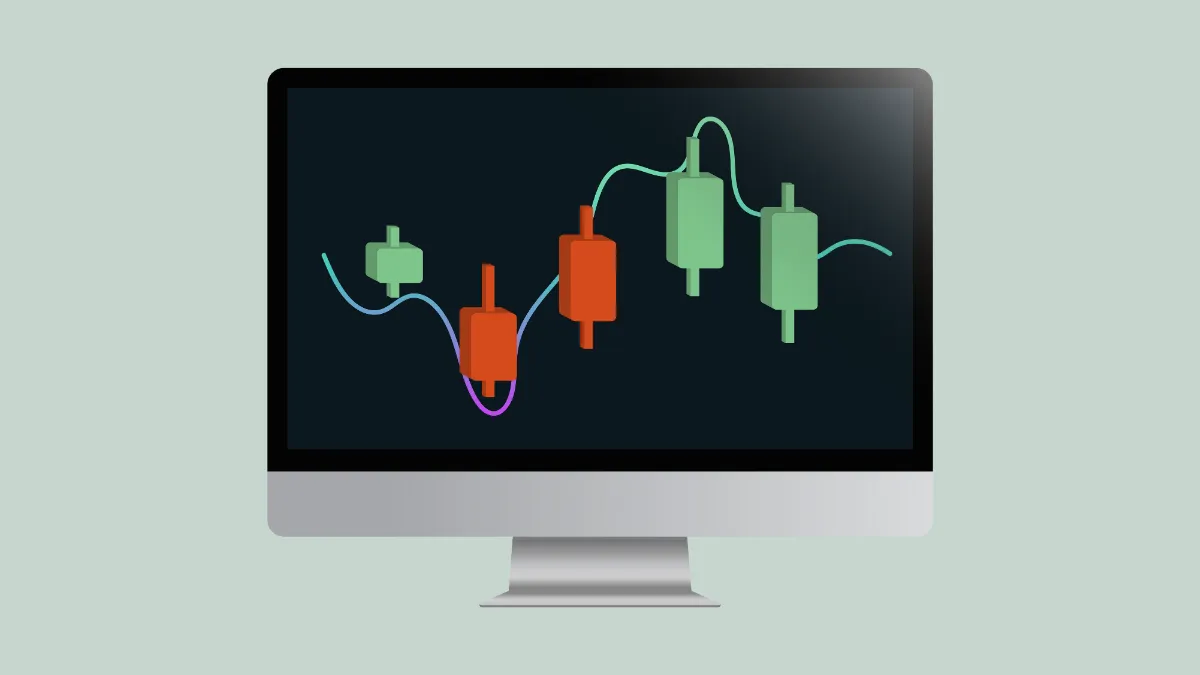
Advantages:- Clear and Understandable Charts: The charts and indicators used in technical analysis are intuitive and easy to understand, allowing traders to quickly grasp market trends.
- Effective for Short-Term Trading: Technical analysis is particularly suitable for short-term traders, providing immediate trading signals.
- No Need for In-Depth Economic Knowledge: Compared to fundamental analysis, technical analysis does not require in-depth research of economic data, which is an advantage for traders focused on short-term trading.
Disadvantages:
- Ignores Market Fundamentals: Technical analysis relies too heavily on historical data and may overlook the impact of sudden economic or political events on the market.
- Over-Reliance on Patterns: The market does not always operate according to past patterns, so technical analysis may fail at times.
5. Combining Technical Analysis with Other Analytical Methods
Although technical analysis is an independent trading tool, many traders combine it with fundamental analysis or sentiment analysis to improve accuracy. For example, fundamental analysis can be used to identify long-term market trends, while technical analysis can help find specific entry and exit points. At the same time, sentiment analysis can be used to confirm short-term market fluctuations, thereby enhancing traders' confidence.Conclusion
Technical analysis is a powerful tool in foreign exchange trading, predicting future price movements by analyzing past market data. Although it has its limitations, combining it with other analytical methods can improve trading accuracy and help traders find profitable opportunities in the market.
Hi, we are the Mr.Forex Research Team
Trading requires not just the right mindset, but also useful tools and insights. We focus on global broker reviews, trading system setups (MT4 / MT5, EA, VPS), and practical forex basics. We personally teach you to master the "operating manual" of financial markets, building a professional trading environment from scratch.
If you want to move from theory to practice:
1. Help share this article to let more traders see the truth.
2. Read more articles related to Forex Education.