
Master Core MT5 & Myfxbook Data to Uncover the Truth of Your Trading Account
Data doesn't lie. Learn to decode two key reports to identify profit blind spots and hidden risks of ruin.
Author: Mr.Forex
Foreword: Facing the Truth in the Mirror
The biggest lie in trading is the memory in our own heads. "I think I've been doing well lately," "I just had bad luck"... these are all subjective illusions. Only cold, hard data can tell you the truth.True professional traders often spend more time on "Review" than they do on "Execution."
This chapter will teach you how to use two major analytical tools to examine your account in depth:
📊 Analysis 1: MT5 Native Report
— For daily and weekly quick health checks.
📈 Analysis 2: Myfxbook Third-Party Analysis
— For monthly and quarterly deep diagnostics; this is also the resume of your trading career.
Analysis 1: MT5 Native Report — Quick Health Check
MT5 has a powerful built-in reporting feature that generates detailed statements in seconds without needing a web connection.1. How to Generate a Report?
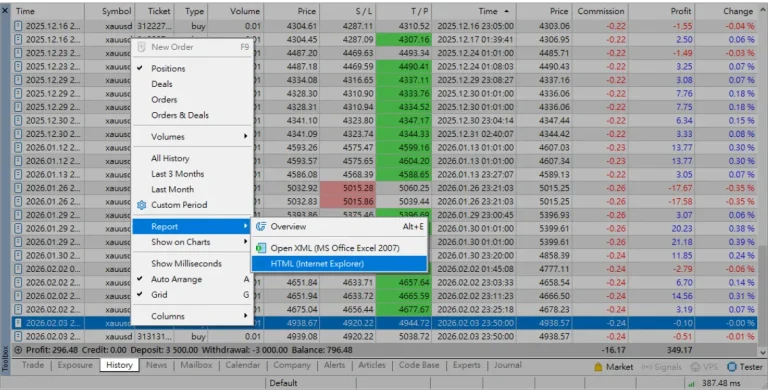
- Open MT5 Desktop (or History on the mobile version).
- Right-click on the "History" tab in the "Toolbox" at the bottom.
- Select "Report" >> "HTML" or Excel.
- The system will automatically generate a detailed trading statement.
2. The Only Four Numbers You Need to Understand
Reports can be overwhelming, so focus on these four key metrics: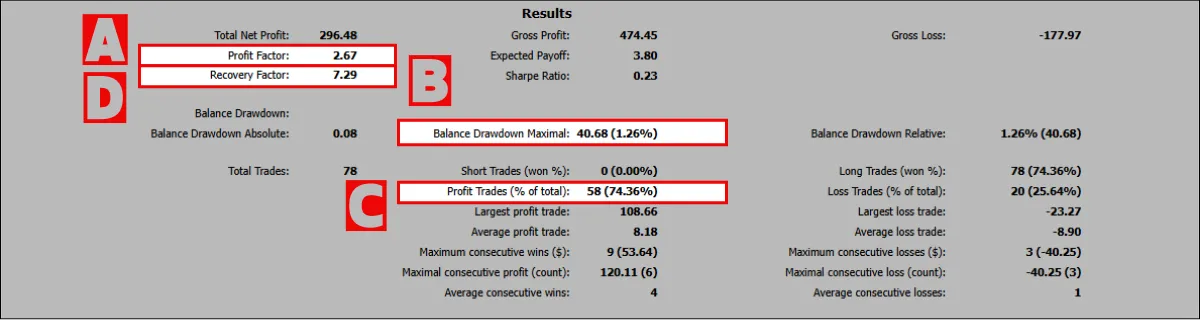
A. Profit Factor — The Most Critical Indicator
B. Balance Drawdown Maximal — Mental Resilience
C. Profit Trades % — Balancing Win Rate and Risk-Reward Ratio
A higher win rate isn't always better; it depends on your "Strategy Profile":
D. 🏅 Advanced Metric: Recovery Factor — Strategy Resilience
There is a highly valuable but often overlooked number in your report.
Definition & Formula:
What does it represent?
If you view a drawdown as an injury on the battlefield, this metric represents your "self-healing ability."
It tells us: "For every $1 of risk you took, how much profit did you ultimately bring home?"
📊 Scoring Standards (Reference Values):
Note that there is no absolute standard; it varies by strategy type:
⚠️ Important Concept: Don't Just Look at the Numbers
A high Recovery Factor (e.g., > 10) isn't always good; look at the source:
It is an authoritative third-party website that reads your account data and transforms it into professional analytical charts.
- Location: Middle section of the report.
- Meaning: For every $1 you lose, how many dollars do you earn back?
- Evaluation Standards:
- 🔴 < 1.0: The overall account is in a loss.
- 🟡 1.0 ~ 1.5: Barely passing; profits aren't enough to offset potential risks.
- 🟢 > 1.5: Strategy performance is healthy; keep it up.
B. Balance Drawdown Maximal — Mental Resilience
- Meaning: The maximum drop in your account equity from "peak" to "trough."
- Evaluation Standards:
- Professional Standard (< 10%): This is the entry threshold for hedge funds and Prop Firms.
- General Standard (20% ~ 30%): For beginner traders, this is a warning line. If losses exceed 30%, you need a 43% gain just to break even—the difficulty increases exponentially.
C. Profit Trades % — Balancing Win Rate and Risk-Reward Ratio
A higher win rate isn't always better; it depends on your "Strategy Profile":
- 🌊 Trend Trading:
- Characteristics: Lower win rate (35% ~ 50%), but one win covers more than two losses (Risk-Reward 1:2 or higher).
- Diagnosis: A 40% win rate is normal as long as you ensure you "let your winners run and cut your losses short."
- ⚡ Scalping/Range Trading:
- Characteristics: Higher win rate (60% ~ 70%+), but profits and losses often offset each other (Risk-Reward 1:1 or lower).
- Diagnosis: If you scalp with a win rate below 50%, your account will gradually shrink due to trading costs.
D. 🏅 Advanced Metric: Recovery Factor — Strategy Resilience
There is a highly valuable but often overlooked number in your report.
Definition & Formula:
Recovery Factor = Total Net Profit ÷ Maximal DrawdownWhat does it represent?
If you view a drawdown as an injury on the battlefield, this metric represents your "self-healing ability."
It tells us: "For every $1 of risk you took, how much profit did you ultimately bring home?"
📊 Scoring Standards (Reference Values):
Note that there is no absolute standard; it varies by strategy type:
- 🔴 < 1.0: Warning. You aren't even earning back what you previously lost.
- 🟡 1.0 ~ 3.0: Stable. This is the normal range for most "Trend Trading" strategies, as capturing big trends requires enduring pullbacks (larger denominator).
- 🟢 > 3.0: Excellent. Profitability far exceeds the risk taken.
⚠️ Important Concept: Don't Just Look at the Numbers
A high Recovery Factor (e.g., > 10) isn't always good; look at the source:
- ✅ True Skill: Strict stop-losses, steady profit accumulation, and minimal drawdown 👉 This is a pro.
- ❌ Illusion: Holding losing trades (Bag-holding). Because trades aren't closed, "Balance Drawdown" shows as 0, resulting in an infinite Recovery Factor. These accounts usually blow up during a single strong market trend.
Analysis 2: Myfxbook — The Deep Diagnostic Report
MT5 reports are for your eyes; Myfxbook is your professional business card for the world.It is an authoritative third-party website that reads your account data and transforms it into professional analytical charts.
Why Use Myfxbook?
Tamper-proof: It verifies that trading records are authentic (Verified), providing credibility that cannot be faked.Deep Data: It tells you things MT5 doesn't (e.g., Which day of the week do you lose the most? How long should you hold a trade to be most profitable?).
1. Linking Your Account (Crucial Security Step)
To showcase your performance on Myfxbook, you need to provide "read-only access."🔑 Investor Password:
This is a special MT5 password. Anyone logging in with this password provides read-only access and prevents any execution or trade modification.
🔒 Security Concept:
Never give your "Master Password" to any website. Providing only the "Investor Password" is completely safe.
2. Interpreting Exclusive Myfxbook Metrics
📉 Risk of RuinThis is the most brutal prediction. It calculates the probability of your account hitting zero based on your historical win rate and risk management.

How to Read This Table?
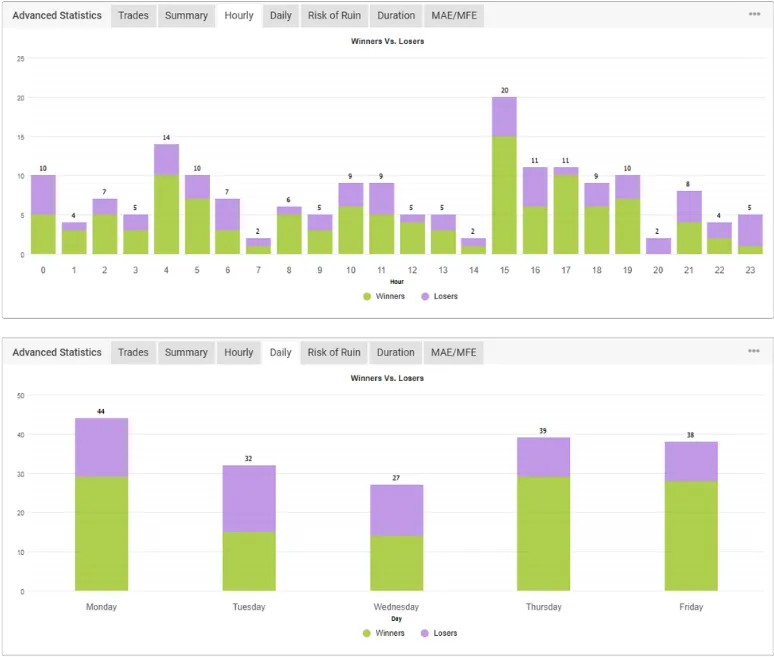
🕒 Hourly/Daily Analysis
This chart shows which specific hours of the day or days of the week are your most profitable or most disastrous.
Application: If data shows you always lose money during the "Asian Session (08:00-14:00)," simply avoid trading then. This single adjustment can significantly boost your overall performance.
- Loss Size: The top of the table lists potential losses from 10% to 100%.
- Probability of Loss: The percentage corresponding below.
- Example Interpretation:
- If the number under "100% (Loss Size)" is < 0.01% 👉 Congratulations, based on your current method, it's virtually impossible to blow your account.
- If the number under "100%" is 99.99% 👉 Warning: mathematics tells us you will eventually lose everything.
🕒 Hourly/Daily Analysis
This chart shows which specific hours of the day or days of the week are your most profitable or most disastrous.
Application: If data shows you always lose money during the "Asian Session (08:00-14:00)," simply avoid trading then. This single adjustment can significantly boost your overall performance.
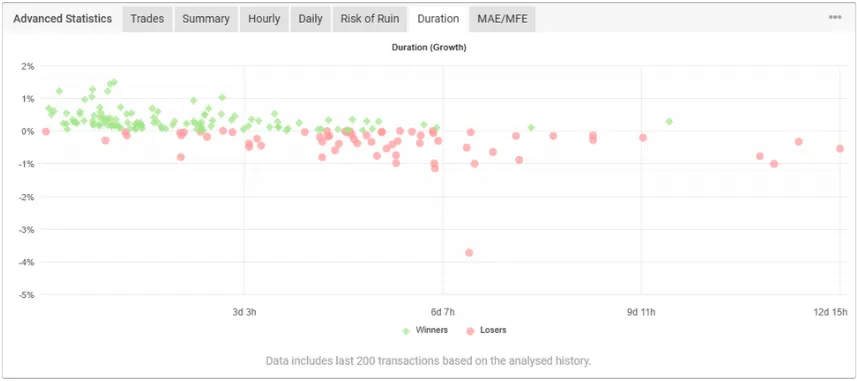
⏳ Duration
Analyze how long you typically hold winning trades versus losing trades.
Typical Amateur Trait: Cutting profits in minutes (unable to hold) while holding losses for days (hoping for a turnaround). Data reveals your true psychological state.
Analyze how long you typically hold winning trades versus losing trades.
Typical Amateur Trait: Cutting profits in minutes (unable to hold) while holding losses for days (hoping for a turnaround). Data reveals your true psychological state.
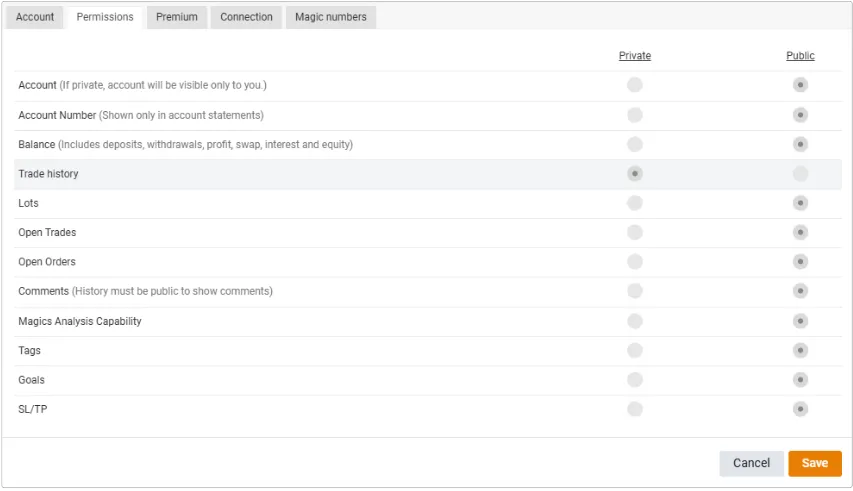
3. Privacy & Display
Once you link Myfxbook, you can choose how much information to make public. This is usually based on two considerations:- Scam Prevention: Hide your Balance and Lots. Don't let strangers know your exact net worth to avoid being targeted by scammers.
- Copy Prevention: Hide Open Trades. If you don't want others to copy your entries for free, set this option to private.
Conclusion: Your Mirror and Your Ticket to Going Pro
Trading is a lonely road. There’s no boss watching over your performance—only you.Make these a habit:
- After Daily Close: Check your MT5 report for balance and floating P/L.
- At Month-End: Open Myfxbook and examine your Profit Factor and error patterns like a doctor reviewing an X-ray.
If the data looks bad, don't be discouraged. It means you’ve found room for improvement. Fix it, and you'll be stronger next month.
🤔 The Next Real-World Question:
Once you've used this method to stabilize your Profit Factor and control your drawdown, you might face a new frustration:"My skills have improved, but I only have $1,000 in capital. Even at 5% a month, that's only $50. How long will this take?"
Don't worry—this is the final piece of our fundamental series. The "beautiful data" you now possess is actually very valuable.
Please open the final chapter: Mr.Forex will show you how to use your skills to gain the opportunity to manage $100,000 in assets.




 繁體中文
繁體中文  العربية
  বাংলা
বাংলা  简体中文
简体中文  香港中文
香港中文  Čeština
  Dansk
Dansk  Nederlands
  English
  Français
  Deutsch
  Ελληνικά
  हिन्दी
  Magyar
  Bahasa Indonesia
  Italiano
  日本語
日本語  한국어
한국어  Bahasa Melayu
  Norsk bokmål
  Polski
  Português do Brasil
  Português
  Română
  Русский
  Español de Argentina
  Español de México
  Español
  Svenska
  ไทย
ไทย  Türkçe
  Українська
  اردو
اردو  Tiếng Việt