

Many long-term investors have heard a familiar piece of advice:
“If you hold a broad-market ETF for the long term, short-term market swings shouldn't matter too much.”
There is some truth to that. Investors with a long time horizon, stable income, and adequate cash reserves may not need to act on every short-term market decline.
But the real test rarely comes when markets are rising.
Imagine a portfolio originally worth US$100,000 that falls to US$50,000 during a market downturn.
Even if the market then rebounds 50%, the portfolio would be worth only US$75,000—not the original US$100,000.
A 50% loss requires a 100% gain just to restore the original portfolio value.
Yet there is a more important question than the arithmetic:
If your portfolio really lost half its value, could you handle the emotional strain?
And if you were also facing job loss, mortgage payments, or family expenses, could you afford to hold on until markets recovered?
These questions point to a key measure of investment risk:
Maximum drawdown (MDD).
Suppose your investments are initially worth US$100,000.
After a 50% decline, the amount remaining is:
US$100,000 × (1 − 50%) = US$50,000
To get from US$50,000 back to US$100,000, you must regain US$50,000.
But that gain is now measured against the remaining US$50,000—not the original US$100,000.
Therefore:
(US$100,000 − US$50,000) ÷ US$50,000 = 100%
The same logic applies to other losses.
This table assumes no additional contributions, withdrawals, or fees. It illustrates only the mathematical relationship between a loss and the gain needed to return to the original amount.
As the table shows, the deeper the loss, the faster the required recovery gain increases.
That is why investment management must consider not only what you can earn when markets rise, but also what you might lose when they fall.
Consider a portfolio that follows this path:
The decline from US$120,000 to US$72,000 is:
(US$72,000 − US$120,000) ÷ US$120,000 = −40%
If this is the deepest decline within the observation period, the maximum drawdown for that period is −40%.
There is an important distinction here:
Drawdown is measured from the previous portfolio peak, not from the amount originally invested.
In this example:
Those figures describe two different things.
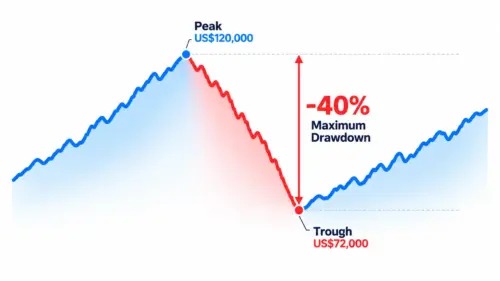
Figure note: This hypothetical portfolio-value chart illustrates how drawdown is measured from a previous peak to a subsequent trough. Maximum drawdown is the largest such decline over the specified period. The amounts and price path are for illustration only and do not represent actual performance of any ETF or quantitative strategy.
Maximum drawdown and volatility are both risk measures, but they capture different aspects of risk.
Volatility describes how much returns typically fluctuate; maximum drawdown measures the deepest fall from a previous peak.
Lower volatility therefore does not necessarily mean a smaller maximum drawdown.
For investors, maximum drawdown helps answer a straightforward question:
“If I had owned this investment, how much would my account have shrunk at the worst point during this period?”
The challenge comes when portfolio values start falling sharply.
Imagine a US$100,000 portfolio that loses 40%, leaving just US$60,000.
The investor is dealing with more than a US$40,000 paper loss.
Questions may begin to pile up:
Deeper drawdowns often bring greater psychological strain.
Even investors who understand market cycles can become anxious as losses mount and begin questioning their original decisions.
Sell now and you risk missing the rebound; stay invested and you risk further losses.
Once the pressure becomes overwhelming, investors may stop regular contributions, repeatedly switch strategies, or panic-sell after a major decline.
Even an approach with strong long-term return potential can be hard to follow if interim losses exceed an investor's tolerance.
Risk management therefore needs to consider not just financial losses but whether investors can psychologically stay with the plan.
Investors may not want to sell, but their financial circumstances can leave them no choice.
Each month, you invest US$500 in a broad-market ETF.
You understand dollar-cost averaging and know that continuing to invest through a downturn can help you accumulate shares at lower prices.
Then a severe recession arrives: stocks plunge and companies begin laying off workers.
Suddenly, you lose your employment income.
The US$500 you used to invest each month must now go toward mortgage payments and living expenses.
There are also children's education costs, insurance premiums, and other bills that cannot wait.
If unemployment lasts for months and your emergency fund runs low, you may have to sell ETF shares while they are down.
It is not that you have forgotten the case for long-term investing.
You may even recognize that lower prices could be an opportunity to invest more—if you had the cash.
But you no longer have spare money to contribute.
Worse, covering everyday expenses might force you to sell assets you intended to hold for years at depressed prices.
The hardest part isn't knowing you should stay invested. It's knowing that, yet not having the cash flow to do so.
When investments and employment income are hit by the same economic downturn, immediate cash needs can derail a long-term plan—even with retirement 20 years away.
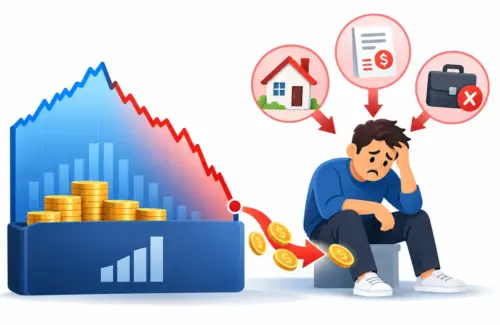
When falling markets coincide with lost income, mortgage payments and everyday bills may force investors to sell long-term holdings at unfavorable prices.
That is why an investment time horizon must be considered alongside emergency savings and drawdown risk.
Suppose you are retired and rely on monthly withdrawals from your portfolio to cover living costs.
If stocks fall sharply early in retirement, you still need to pay for daily expenses, medical care, and family commitments.
Selling depressed assets to raise cash leaves fewer holdings to benefit from a later rebound.
This relates to sequence-of-returns risk in retirement planning.
When withdrawals continue, the order in which investment returns occur can affect how long the portfolio lasts—even when long-term average returns are the same.
Working investors may lose their jobs during a crash; retirees may have to keep withdrawing funds.
The circumstances differ, but the central problem is the same:
When investments fall, investors may not be financially able to wait for a recovery.
This is why managing maximum drawdown is about more than improving a performance chart.
A deep drawdown can bring shrinking assets, emotional distress, and cash-flow needs at the same time.
Sound cash planning and disciplined risk management can help cushion deep drawdowns.
The goal is not just to limit losses, but to make a long-term investment plan easier to sustain through difficult markets.
But investors also need to ask:
How long will it take to regain the previous peak?
This is commonly called drawdown recovery time.
Consider two portfolios:
Mathematically, Portfolio B has a much lower recovery hurdle.
That does not mean Portfolio B will necessarily recover sooner. The time required depends on actual subsequent returns and market conditions.
The gain needed to break even is a matter of arithmetic; the time needed depends on what markets actually do next.
The table compares four notable historical drawdowns in SPY and QQQ, including the time from peak to trough and from trough back to the previous peak.
Sources:
Data notes: Figures use daily closing data adjusted for reinvested dividends; month counts are approximate. SPY statistics are referenced through September 30, 2026, and QQQ statistics through October 7, 2026. Each row represents a specific historical event, not an ETF's average recovery time. Price-only data that exclude dividends may produce different drawdowns and recovery dates.
As the table shows, even US equity ETFs can have dramatically different recovery periods across market crises.
SPY returned to its previous peak in roughly six months after the 2020 pandemic crash. QQQ took nearly 15 years after the 2000 dot-com bust.
During the 2008 financial crisis, SPY also took close to five years to recover from peak to peak.
These examples underscore a key distinction:
Drawdown measures the depth of a loss; recovery time measures the wait.
For investors covering mortgages, family expenses, or retirement living costs, that waiting period is itself a meaningful financial risk.
So when comparing ETFs or other strategies, examine maximum drawdown and recovery time alongside returns.
But investors can take several steps to reduce the effect of deep drawdowns on their finances and long-term plans.
If mortgage payments, household expenses, or unexpected medical bills depend entirely on equity ETFs, a sharp market decline can create pressure to sell.
An emergency fund suited to your household obligations and income stability can help keep short-term needs from derailing long-term investing.
As the time to use the money approaches, liquidity and price stability become more important.
Investment horizons are therefore about when the money may be needed—not simply the investor's age.
Equities, high-quality bonds, cash, and strategies driven by other sources of return have different risk characteristics.
Diversification can reduce reliance on one market, but investors must still consider how assets may move together during a crisis.
A strategy's risk-management value cannot be judged solely by its correlation with stocks or by its standalone return.
A more useful test is whether adding the strategy improves the overall portfolio's maximum drawdown and risk profile over a consistent historical period, using reasonable cost assumptions.
The goal of risk management is not to find an investment that never falls. It is to build an allocation with risks you can realistically bear.
Taking larger positions or greater market exposure may boost returns in a strong market, but it can also magnify losses when markets turn.
For Mr.Forex, strategy design considers not only returns but also the size of drawdowns investors may have to endure in adverse markets.
We make drawdown management a core risk-control principle rather than taking unlimited trading risk in pursuit of extreme returns.
Each strategy sets risk-control reference levels appropriate to its trading logic and risk characteristics. Position sizing and risk monitoring aim to limit the impact of severe drawdowns.
This approach may mean giving up some profit opportunities in higher-risk market conditions.
What matters more to us is whether investors can withstand declines and continue with their original plan when markets move against expectations.
At Mr.Forex, we pursue reasonable returns while managing drawdowns and investment stress—not returns at any cost.
Prioritize risk controls, not get-rich-quick returns.
But the challenge of a deep drawdown goes far beyond that arithmetic.
Investors may face years of waiting, psychological pressure, and urgent cash needs caused by lost income or living expenses.
The histories of SPY and QQQ show that even widely held equity ETFs have sometimes spent years below their previous peaks.
Long-term investing, then, is not just about choosing assets with growth potential.
What matters most is building a plan you can keep following when markets turn against you.
Mr.Forex likewise emphasizes maximum drawdown, risk discipline, and the experience of staying invested, so investors can evaluate strategies with a fuller understanding of risk.
Mr.Forex provides strategy information to help investors understand different trading methods and their risks.
Understand the risks first, then decide whether a strategy suits you. Don't invest just to chase higher returns.
Risk Notice: This article is for educational and informational purposes only and does not constitute personalized investment advice or guarantee returns. All hypothetical figures and scenarios are illustrative, not actual ETF or Mr.Forex strategy performance. Historical SPY and QQQ data reflect specific market events reported by public sources. Risk controls do not guarantee a loss limit. Market gaps, liquidity constraints, leverage, model failures, and execution risks may result in greater-than-expected losses. Past performance, maximum drawdown, and recovery time are not reliable indicators of future results.
“If you hold a broad-market ETF for the long term, short-term market swings shouldn't matter too much.”
There is some truth to that. Investors with a long time horizon, stable income, and adequate cash reserves may not need to act on every short-term market decline.
But the real test rarely comes when markets are rising.
Imagine a portfolio originally worth US$100,000 that falls to US$50,000 during a market downturn.
Even if the market then rebounds 50%, the portfolio would be worth only US$75,000—not the original US$100,000.
A 50% loss requires a 100% gain just to restore the original portfolio value.
Yet there is a more important question than the arithmetic:
If your portfolio really lost half its value, could you handle the emotional strain?
And if you were also facing job loss, mortgage payments, or family expenses, could you afford to hold on until markets recovered?
These questions point to a key measure of investment risk:
Maximum drawdown (MDD).
1. Why Does a 50% Loss Require a 100% Gain to Break Even?
Start with a simple example.Suppose your investments are initially worth US$100,000.
After a 50% decline, the amount remaining is:
US$100,000 × (1 − 50%) = US$50,000
To get from US$50,000 back to US$100,000, you must regain US$50,000.
But that gain is now measured against the remaining US$50,000—not the original US$100,000.
Therefore:
(US$100,000 − US$50,000) ÷ US$50,000 = 100%
The same logic applies to other losses.
This table assumes no additional contributions, withdrawals, or fees. It illustrates only the mathematical relationship between a loss and the gain needed to return to the original amount.
As the table shows, the deeper the loss, the faster the required recovery gain increases.
That is why investment management must consider not only what you can earn when markets rise, but also what you might lose when they fall.
2. What Is Maximum Drawdown (MDD)?
Maximum drawdown (MDD) is the largest drop from a previous peak to a later trough.Consider a portfolio that follows this path:
- You initially invest US$100,000.
- The portfolio rises to US$120,000, setting a new peak.
- Markets decline and the portfolio falls to US$72,000.
- Markets later recover and the portfolio gradually rises.
The decline from US$120,000 to US$72,000 is:
(US$72,000 − US$120,000) ÷ US$120,000 = −40%
If this is the deepest decline within the observation period, the maximum drawdown for that period is −40%.
There is an important distinction here:
Drawdown is measured from the previous portfolio peak, not from the amount originally invested.
In this example:
- Relative to the initial US$100,000 investment, US$72,000 represents a 28% loss.
- Relative to the earlier US$120,000 peak, US$72,000 represents a 40% drawdown.
Those figures describe two different things.
Figure note: This hypothetical portfolio-value chart illustrates how drawdown is measured from a previous peak to a subsequent trough. Maximum drawdown is the largest such decline over the specified period. The amounts and price path are for illustration only and do not represent actual performance of any ETF or quantitative strategy.
Maximum drawdown and volatility are both risk measures, but they capture different aspects of risk.
Volatility describes how much returns typically fluctuate; maximum drawdown measures the deepest fall from a previous peak.
Lower volatility therefore does not necessarily mean a smaller maximum drawdown.
For investors, maximum drawdown helps answer a straightforward question:
“If I had owned this investment, how much would my account have shrunk at the worst point during this period?”
3. Why Do Deep Drawdowns Make Long-Term Investing So Difficult?
When markets are rising, many people believe they can stay invested for the long term.The challenge comes when portfolio values start falling sharply.
Imagine a US$100,000 portfolio that loses 40%, leaving just US$60,000.
The investor is dealing with more than a US$40,000 paper loss.
Questions may begin to pile up:
- Will the market keep falling?
- Could I withstand an even bigger loss?
- Was there something wrong with the ETF or strategy I chose?
- Should I sell now and buy back when the market settles?
- What happens to my financial plans if the portfolio takes years to recover?
Deeper drawdowns often bring greater psychological strain.
Even investors who understand market cycles can become anxious as losses mount and begin questioning their original decisions.
Sell now and you risk missing the rebound; stay invested and you risk further losses.
Once the pressure becomes overwhelming, investors may stop regular contributions, repeatedly switch strategies, or panic-sell after a major decline.
Even an approach with strong long-term return potential can be hard to follow if interim losses exceed an investor's tolerance.
Risk management therefore needs to consider not just financial losses but whether investors can psychologically stay with the plan.
4. Why Might Long-Term Investors Be Forced to Sell During a Recession?
Beyond the emotional pressure, a market crash can create another problem:Investors may not want to sell, but their financial circumstances can leave them no choice.
Working Investors: Knowing They Should Hold Doesn't Mean They Can
Imagine you are 40 years old, with more than 20 years until retirement.Each month, you invest US$500 in a broad-market ETF.
You understand dollar-cost averaging and know that continuing to invest through a downturn can help you accumulate shares at lower prices.
Then a severe recession arrives: stocks plunge and companies begin laying off workers.
Suddenly, you lose your employment income.
The US$500 you used to invest each month must now go toward mortgage payments and living expenses.
There are also children's education costs, insurance premiums, and other bills that cannot wait.
If unemployment lasts for months and your emergency fund runs low, you may have to sell ETF shares while they are down.
It is not that you have forgotten the case for long-term investing.
You may even recognize that lower prices could be an opportunity to invest more—if you had the cash.
But you no longer have spare money to contribute.
Worse, covering everyday expenses might force you to sell assets you intended to hold for years at depressed prices.
The hardest part isn't knowing you should stay invested. It's knowing that, yet not having the cash flow to do so.
When investments and employment income are hit by the same economic downturn, immediate cash needs can derail a long-term plan—even with retirement 20 years away.
When falling markets coincide with lost income, mortgage payments and everyday bills may force investors to sell long-term holdings at unfavorable prices.
That is why an investment time horizon must be considered alongside emergency savings and drawdown risk.
Retirees: Withdrawals May Be Necessary Even at Market Lows
Retirees face a different challenge.Suppose you are retired and rely on monthly withdrawals from your portfolio to cover living costs.
If stocks fall sharply early in retirement, you still need to pay for daily expenses, medical care, and family commitments.
Selling depressed assets to raise cash leaves fewer holdings to benefit from a later rebound.
This relates to sequence-of-returns risk in retirement planning.
When withdrawals continue, the order in which investment returns occur can affect how long the portfolio lasts—even when long-term average returns are the same.
Working investors may lose their jobs during a crash; retirees may have to keep withdrawing funds.
The circumstances differ, but the central problem is the same:
When investments fall, investors may not be financially able to wait for a recovery.
This is why managing maximum drawdown is about more than improving a performance chart.
A deep drawdown can bring shrinking assets, emotional distress, and cash-flow needs at the same time.
Sound cash planning and disciplined risk management can help cushion deep drawdowns.
The goal is not just to limit losses, but to make a long-term investment plan easier to sustain through difficult markets.
5. How Are Maximum Drawdown and Recovery Time Related?
Maximum drawdown tells us how far an investment fell.But investors also need to ask:
How long will it take to regain the previous peak?
This is commonly called drawdown recovery time.
Consider two portfolios:
- Portfolio A: a 50% maximum drawdown requires a 100% gain to regain the previous peak.
- Portfolio B: a 20% maximum drawdown requires a 25% gain to regain the previous peak.
Mathematically, Portfolio B has a much lower recovery hurdle.
That does not mean Portfolio B will necessarily recover sooner. The time required depends on actual subsequent returns and market conditions.
The gain needed to break even is a matter of arithmetic; the time needed depends on what markets actually do next.
How Long Have Investors Waited for Historical ETF Recoveries?
Even ETFs tracking major market indexes have sometimes taken years to recover from a prior peak.The table compares four notable historical drawdowns in SPY and QQQ, including the time from peak to trough and from trough back to the previous peak.
Sources:
- Tideline|S&P 500 Bear Markets and Corrections: SPY historical drawdowns, peak and trough dates, and recovery dates.
- PortfoliosLab|SPY Historical Drawdowns: Cross-reference for SPY drawdowns and recovery periods.
- Investors FastTrack|QQQ Maximum Drawdown & Recovery: QQQ maximum drawdown and recovery record during the dot-com bust.
Data notes: Figures use daily closing data adjusted for reinvested dividends; month counts are approximate. SPY statistics are referenced through September 30, 2026, and QQQ statistics through October 7, 2026. Each row represents a specific historical event, not an ETF's average recovery time. Price-only data that exclude dividends may produce different drawdowns and recovery dates.
As the table shows, even US equity ETFs can have dramatically different recovery periods across market crises.
SPY returned to its previous peak in roughly six months after the 2020 pandemic crash. QQQ took nearly 15 years after the 2000 dot-com bust.
During the 2008 financial crisis, SPY also took close to five years to recover from peak to peak.
These examples underscore a key distinction:
Drawdown measures the depth of a loss; recovery time measures the wait.
For investors covering mortgages, family expenses, or retirement living costs, that waiting period is itself a meaningful financial risk.
So when comparing ETFs or other strategies, examine maximum drawdown and recovery time alongside returns.
6. How Can Investors Manage Drawdown Risk?
No allocation can eliminate the risk of investment losses altogether.But investors can take several steps to reduce the effect of deep drawdowns on their finances and long-term plans.
6.1 Maintain Emergency Savings to Avoid Forced Selling at Market Lows
Keep long-term investments separate from cash needed for short-term living expenses.If mortgage payments, household expenses, or unexpected medical bills depend entirely on equity ETFs, a sharp market decline can create pressure to sell.
An emergency fund suited to your household obligations and income stability can help keep short-term needs from derailing long-term investing.
6.2 Match Investment Risk to When You'll Need the Money
A home down payment needed in five years and retirement funds needed in 20 years should not necessarily be invested the same way.As the time to use the money approaches, liquidity and price stability become more important.
Investment horizons are therefore about when the money may be needed—not simply the investor's age.
6.3 Avoid Concentrating All Assets in the Same Market Risk
A broad-market ETF diversifies company-specific risk, but it still remains exposed to an overall equity-market decline.Equities, high-quality bonds, cash, and strategies driven by other sources of return have different risk characteristics.
Diversification can reduce reliance on one market, but investors must still consider how assets may move together during a crisis.
6.4 Assess Whether a Strategy Actually Improves Portfolio Drawdown
Beyond traditional stock-and-bond allocations, investors can examine quantitative strategies that follow different trading approaches.A strategy's risk-management value cannot be judged solely by its correlation with stocks or by its standalone return.
A more useful test is whether adding the strategy improves the overall portfolio's maximum drawdown and risk profile over a consistent historical period, using reasonable cost assumptions.
The goal of risk management is not to find an investment that never falls. It is to build an allocation with risks you can realistically bear.
7. Why Does Mr.Forex Put Drawdown Management at the Center?
Seeking higher returns often involves trade-offs among different risks.Taking larger positions or greater market exposure may boost returns in a strong market, but it can also magnify losses when markets turn.
For Mr.Forex, strategy design considers not only returns but also the size of drawdowns investors may have to endure in adverse markets.
We make drawdown management a core risk-control principle rather than taking unlimited trading risk in pursuit of extreme returns.
Each strategy sets risk-control reference levels appropriate to its trading logic and risk characteristics. Position sizing and risk monitoring aim to limit the impact of severe drawdowns.
This approach may mean giving up some profit opportunities in higher-risk market conditions.
What matters more to us is whether investors can withstand declines and continue with their original plan when markets move against expectations.
At Mr.Forex, we pursue reasonable returns while managing drawdowns and investment stress—not returns at any cost.
Prioritize risk controls, not get-rich-quick returns.
8. Conclusion: Investing Is Also About Being Able to Stay Invested
A 50% loss requires a 100% gain to break even.But the challenge of a deep drawdown goes far beyond that arithmetic.
Investors may face years of waiting, psychological pressure, and urgent cash needs caused by lost income or living expenses.
The histories of SPY and QQQ show that even widely held equity ETFs have sometimes spent years below their previous peaks.
Long-term investing, then, is not just about choosing assets with growth potential.
What matters most is building a plan you can keep following when markets turn against you.
Mr.Forex likewise emphasizes maximum drawdown, risk discipline, and the experience of staying invested, so investors can evaluate strategies with a fuller understanding of risk.
Explore Quantitative Trading Strategies Built Around Risk Management
If you already hold ETFs for the long term and want to explore other return drivers, review the historical performance, maximum drawdown, recovery time, and risk-control rules of quantitative strategies.Mr.Forex provides strategy information to help investors understand different trading methods and their risks.
Understand the risks first, then decide whether a strategy suits you. Don't invest just to chase higher returns.
Risk Notice: This article is for educational and informational purposes only and does not constitute personalized investment advice or guarantee returns. All hypothetical figures and scenarios are illustrative, not actual ETF or Mr.Forex strategy performance. Historical SPY and QQQ data reflect specific market events reported by public sources. Risk controls do not guarantee a loss limit. Market gaps, liquidity constraints, leverage, model failures, and execution risks may result in greater-than-expected losses. Past performance, maximum drawdown, and recovery time are not reliable indicators of future results.




 繁體中文
 العربية
 বাংলা
 简体中文
 香港中文
 Čeština
 Dansk
 Nederlands
 English
 Français
 Deutsch
 Ελληνικά
 हिन्दी
 Magyar
 Bahasa Indonesia
 Italiano
 日本語
 한국어
 Bahasa Melayu
 Norsk bokmål
 Polski
 Português do Brasil
 Português
 Română
 Русский
 Español de Argentina
 Español de México
 Español
 Svenska
 ไทย
 Türkçe
 Українська
 اردو
 Tiếng Việt