

"I've already bought a broad-market ETF that invests in hundreds of companies. Why would I need any other investments?"
If you've wondered the same thing, it's a reasonable question.
For many long-term investors, a broad-market ETF is an effective way to build wealth.
It offers exposure to overall market growth without the time-consuming task of selecting individual stocks, while substantially reducing the risk of a single company's failure.
But there's an important question that often gets overlooked:
An ETF diversifies single-stock risk. What diversifies your exposure when the whole market falls?
Even owning several ETFs can mean holding the same companies repeatedly, or exposing your entire portfolio to similar market risks.
History also shows that broad equity ETFs holding hundreds of companies have suffered drawdowns exceeding 50%, followed by recoveries lasting years.
That's why portfolio construction requires an understanding of holding overlap, correlation, and risk management.
Effective diversification isn't simply about owning more products. It's about combining genuinely different sources of return.
Starting with familiar investments such as ETFs and bonds, this article explains company-specific versus market-wide risk, the role of positive and low correlations, and how alternative investment strategies might change a portfolio's overall risk-and-return profile.
Your money is spread across large publicly traded U.S. companies rather than concentrated in one stock.
This type of diversification offers real benefits.
If one company performs poorly, misses earnings expectations, or suffers a steep share-price decline, other holdings may offset part of that loss.
But what happens when the entire market falls?
Think of a recession, financial crisis, runaway inflation, or a broad shift by investors away from risk.
At those times, an ETF holding hundreds of companies can still lose substantial value as the market declines together.
The reason is simple:
ETFs diversify company-specific risk, but they cannot eliminate systematic market risk.
You own shares in many different businesses, yet those businesses remain exposed to common economic conditions and market forces.
It's like putting eggs into hundreds of separate baskets, then loading every basket onto the same truck.
Each basket is less vulnerable on its own, but if the truck overturns, they can all be affected.
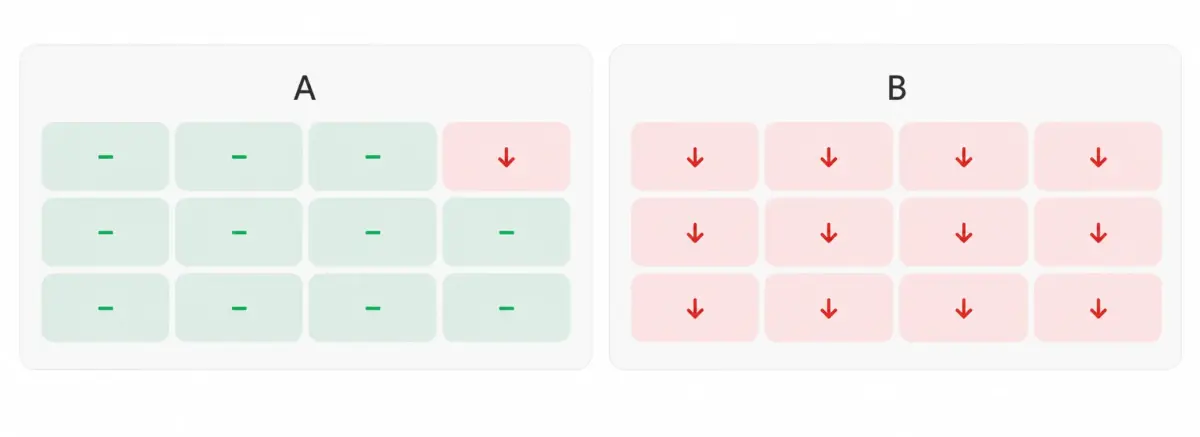
Holding many companies helps a broad-market ETF reduce company-specific risk (Scenario A), but a market-wide decline can still expose all holdings to systematic risk (Scenario B).
But three differently named ETFs might own many of the same businesses. That's like using three baskets filled with essentially the same eggs.
Your portfolio might, for example, contain:
These funds track different indexes or use different selection rules, yet may all own some of the same large technology companies.
If a business appears in multiple ETFs, your actual exposure to that company could be greater than you realize.
Three ETFs do not necessarily provide three independent sources of risk.
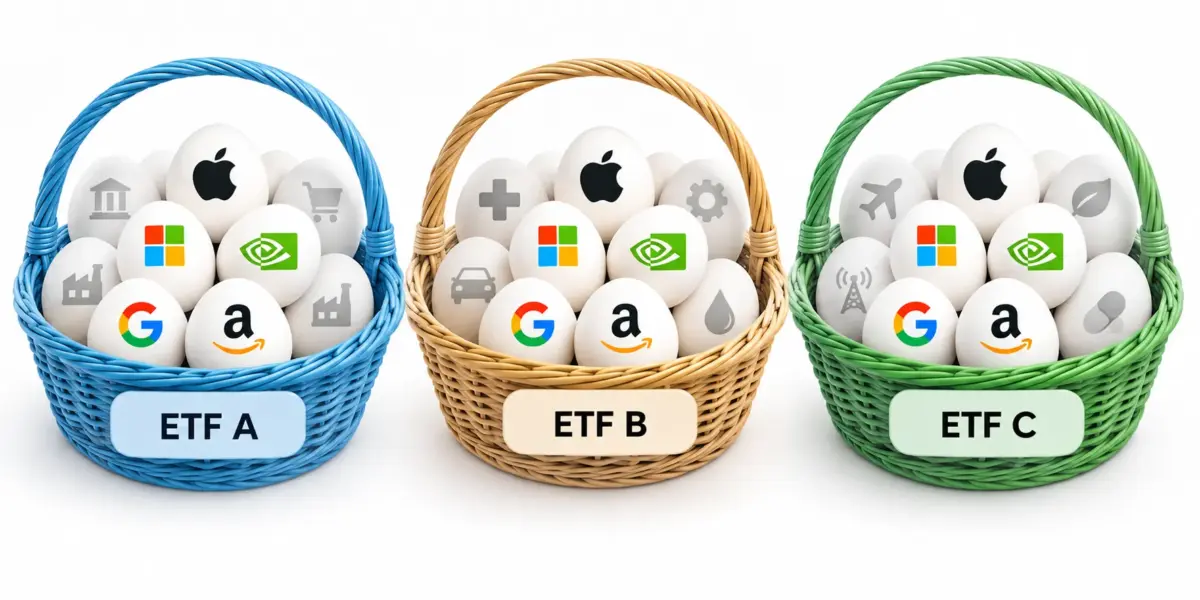
Figure: Different ETFs can hold the same companies. Check their underlying holdings and weights rather than judging diversification solely by the number of funds.
Holding overlap isn't the only concern, however.
Even ETFs holding completely different companies can respond to the same interest rates, economic growth, and market sentiment, falling together in a crisis.
So the next portfolio-construction question isn't "How many more stocks can I buy?" but:
Beyond equities, does my portfolio have any other distinct sources of return?
Its value ranges from -1 to +1.
For example, two ETFs tracking U.S. large-cap stocks may have very similar performance patterns even if they have different names and issuers.
Owning two highly correlated ETFs may add little meaningful diversification.
When one performs poorly, the other may move the other way.
Certain combinations of equities and government bonds have displayed negative correlation in particular market environments.
But remember: Stocks and bonds are not always negatively correlated.
During periods of rising inflation and rapidly increasing interest rates, stocks and bonds can decline together.
Whether bonds diversify equity risk therefore depends on the prevailing market environment.
For example:
This does not mean an uncorrelated strategy cannot lose money, or that it will profit when stocks decline.
Rather, it means:
Its returns need not follow the direction of the equity market.
A correlation coefficient close to zero (r ≈ 0) also does not mean that two assets are completely independent. They may still have nonlinear relationships or suffer losses together during extreme market conditions.
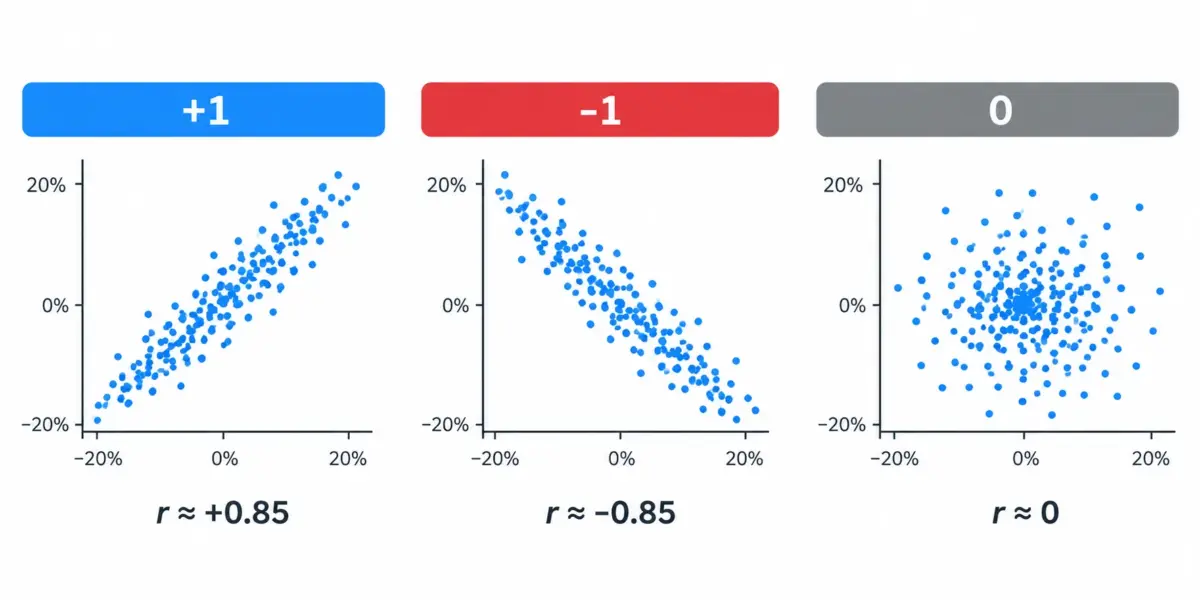
Positively correlated assets (r > 0) tend to move together; negatively correlated assets (r < 0) tend to move in opposite directions; near-zero correlation (r ≈ 0) indicates little clear linear relationship.
For investors already holding substantial broad-market ETF positions, this lack of synchronized movement may be valuable.
Diversification isn't about making every asset rise. It's about avoiding excessive dependence on the same underlying forces.
"I already own bond funds alongside my ETFs. Isn't that sufficient?"
Combining stocks and bonds is a classic approach to asset allocation.
Equities commonly serve as long-term growth holdings, while higher-quality bonds may provide interest income and moderate equity volatility under some conditions.
But bonds and stocks do not consistently offset one another's risks.
When inflation rises, interest rates adjust rapidly, or market liquidity deteriorates, both may come under pressure.
Even a portfolio containing both equity ETFs and bond funds may therefore remain exposed to shared market forces.
Some investors consequently investigate additional sources of return, such as:
None of these strategies is automatically better than ETFs or bonds, and not every strategy has low correlation.
They merit research because some may use distinct trading rules, portfolio positions, and risk drivers to offer return opportunities outside traditional equities and fixed income.
Asset allocation cannot prevent losses. It reduces dependence on any one market environment.
Portfolio risk is not simply the sum of the risks of individual holdings. It also depends on how their returns correlate.
Imagine two different sources of return.
Asset A is a broad-market equity ETF, while Asset B is an investment strategy with low correlation to that market.
If Asset B has acceptable risk, costs, and expected returns, an appropriate combination may reduce total portfolio volatility.
Why?
Because the two assets do not necessarily rise or fall at the same time.
When one underperforms, the other might remain relatively stable or follow a different return pattern.
That potential offset is one of the foundations of diversification.
With a 50% allocation to each, the portfolio's theoretical annualized volatility could fall to approximately 14.1%, below the 20% volatility of either asset held alone.
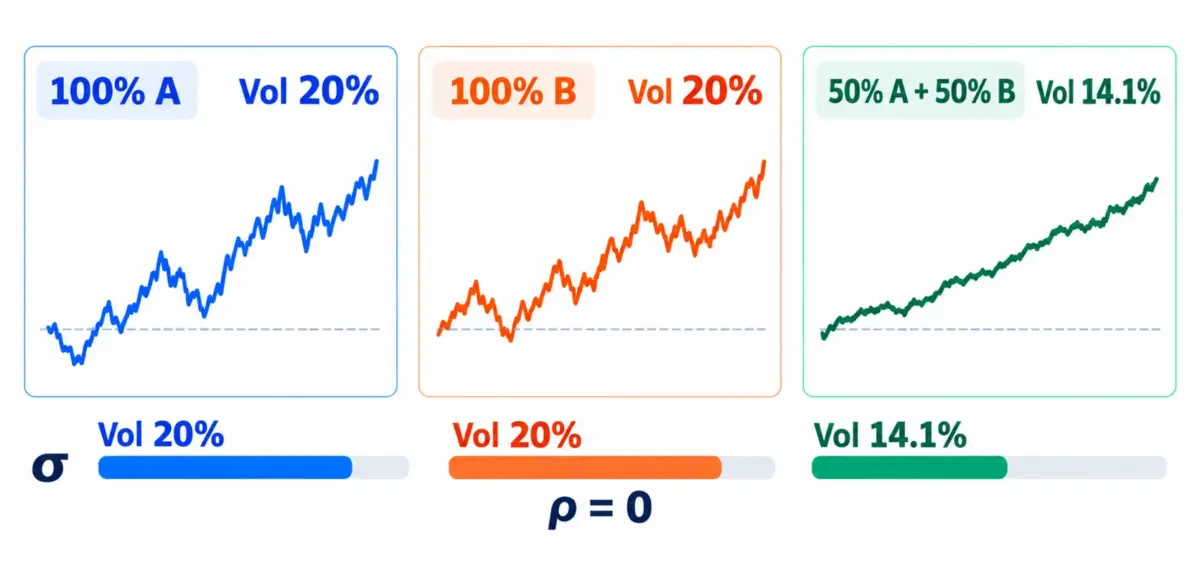
The chart uses hypothetical performance paths to illustrate diversification: Even if Assets A and B both end with positive returns, each may experience substantial swings. Combining assets with low correlation could reduce volatility while maintaining similar expected returns, potentially smoothing the portfolio's growth path.
This is known as the "diversification benefit".
The growth curves are conceptual illustrations, not actual investment performance. Real outcomes depend on asset returns, changing correlations, allocation weights, trading costs, and other risks. Low correlation does not guarantee a profit.
The real objective is:
Lower portfolio volatility while targeting a similar expected return.
This may improve a portfolio's "risk-adjusted return", which considers how much risk is taken to earn a given return.
For long-term investors, volatility and maximum drawdown deserve attention alongside cumulative returns.
The challenge isn't only finding investments with long-term profit potential. It's also maintaining a suitable plan when markets become turbulent.
You believe in the long-term case for equities and accept ordinary market fluctuations.
Adding a low-correlation strategy might then be less about increasing returns and more about reducing the portfolio's complete dependence on equity-market performance.
Consider three approaches to compare.
The drawback is that the portfolio is dominated by equity-market risk. A major correction could cause a corresponding drawdown.
Higher-quality bonds may generate interest income and improve volatility in some circumstances, but they still carry interest-rate and credit risks, including the possibility that bonds and stocks fall together.
If correlation stays relatively low and the strategy itself has reasonable risk-return characteristics, the combination may further improve portfolio efficiency.
Quantitative strategies can nevertheless lose principal and face model failure, liquidity problems, leverage, and execution risk. Historically low correlation is no guarantee of protection during severe market stress.
None of the three allocations is universally superior, and investors do not necessarily have to choose just one of stocks, bonds, and quantitative strategies.
A combination of all three may also deserve consideration.
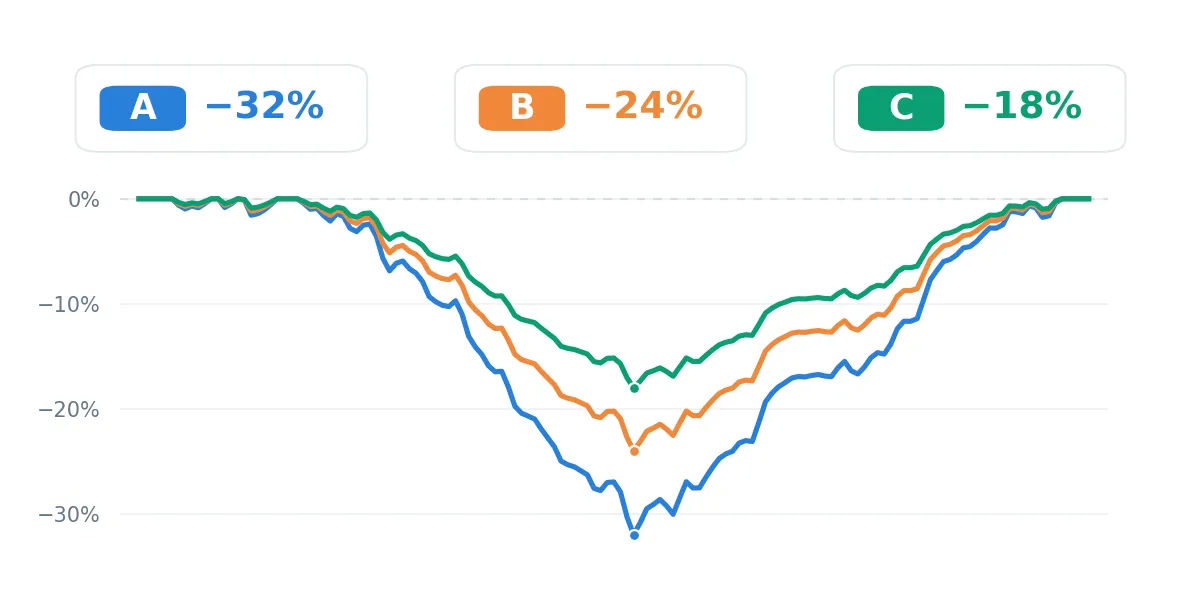
The chart compares hypothetical maximum drawdowns for three allocations: A (100% broad-market ETF) at −32%, B (ETF + bonds) at −24%, and C (ETF + low-correlation strategy) at −18%.
These hypothetical figures illustrate how different return drivers might soften a portfolio's losses; they are not actual performance results. Real-world effects require verification using historical data.
In real markets, however, even equity ETFs diversified across hundreds of companies have experienced declines far greater than many investors expect.
Maximum drawdown (MDD) is the largest peak-to-trough percentage decline of an asset over a specified observation period.
Besides the depth of a decline, investors should ask: How long did it take to fall from peak to trough? And how long did it take to regain the previous high?
Representative historical episodes involving SPY and QQQ offer a more concrete perspective.
Historical data sources:
Notes on the data: These historical figures use adjusted total returns based on daily closing prices with dividends reinvested; month counts are approximate. The periods shown run from peak to recovery for specified market episodes, not the ETFs' average recovery times. The SPY data source is updated through September 30, 2026, and the QQQ source through October 2026. Price-only returns and dividend-reinvested total returns can yield different drawdowns and recovery dates.
As the table shows, SPY lost approximately 55.2% during the 2008 financial crisis, and it took nearly five years to recover fully from its pre-crisis peak.
QQQ's drawdown after the 2000 technology bubble burst reached approximately 83%, and recovering its previous high took close to fifteen years.
By contrast, SPY returned to its previous high roughly six months after the 2020 pandemic crash.
Maximum drawdown shows how deep the fall was; recovery time shows how long investors waited.
For long-term investors, the hardest situations may involve more than emotional strain.
Suppose you're 40 years old and invest US$500 every month in a broad-market ETF.
You understand dollar-cost averaging and are willing to keep investing through market declines.
But if a recession brings both falling stock prices and layoffs, you might suddenly lose your employment income.
Mortgage payments, living expenses, and your children's education costs do not stop.
Without an adequate emergency fund, you might have to sell ETF shares at a loss to cover essential expenses.
Knowing to stay invested is one thing. Having the cash flow to do it is another.
Retirees face a related challenge: making regular withdrawals during a market downturn can leave less invested to participate in a later recovery.
Managing deep drawdowns and cash-flow risk therefore matters alongside estimating investment returns, because it can make a long-term plan more sustainable.
That's why maximum drawdown belongs in any serious asset-allocation assessment.
The right allocation depends on your goals, risk tolerance, investment horizon, and the role each asset plays in the wider portfolio.
Sometimes the more useful question is:
"Do I need a source of return that doesn't depend on a rising stock market?"
That's a different portfolio-construction perspective Mr.Forex hopes to introduce through quantitative trading strategies.
One metric worth reviewing is the historical return correlation between the strategy and the broad market.
If returns are measured over the same period and at the same frequency, a calculated coefficient close to 0 indicates little evident linear co-movement between the strategy and equity-market returns during that observation window.
Such strategies may therefore have portfolio characteristics that differ from conventional equity ETFs.
Historical correlation can change with market conditions, however. A previously weak relationship with equity returns does not ensure the same relationship will continue.
ETFs can remain core long-term holdings while quantitative strategies are evaluated as potential additional return sources.
The key comparison is not simply how much money a quantitative strategy made on its own, but:
What happens to your overall risk-and-return profile when that strategy is added to your existing ETF portfolio?
For example:
These are the questions asset allocation should address.
Consider these measures together:
Mr.Forex focuses not on maximizing returns at any cost, but on seeking reasonable returns while working to manage drawdowns and the pressures investors may face along the way.
Focus on risk control, not getting rich overnight.
If you're considering whether a low-correlation quantitative strategy belongs in your portfolio, start by reviewing the performance and risk information Mr.Forex makes available before deciding whether to invest.
If you want to reduce dependence on equities further, you could research bonds or other low-correlation assets and assess whether they improve your portfolio's risk profile.
For example, an S&P 500 ETF, a Nasdaq 100 ETF, and a large-cap growth ETF may all hold some of the same major technology firms.
Look beyond the number of ETFs and examine underlying holdings, portfolio weights, and overall equity-market exposure.
It does not imply that the assets are completely independent or free of loss risk.
Negatively correlated assets may offset some market movements more directly, but the relationship is not always stable.
Zero-correlation assets may instead provide different sources of return.
Both should be assessed alongside expected returns, volatility, costs, and risks in extreme markets.
Quantitative trading simply uses rules, statistical models, or programmatic methods to execute trades.
Different strategies can be positively, negatively, or weakly correlated with equities; their actual performance data must be used to calculate that relationship.
The outcome depends on the strategy's volatility, its correlation with the ETF, allocation size, and market conditions.
A high-risk strategy can increase total portfolio risk even if its correlation is close to zero.
Lower volatility in typical market conditions also does not guarantee protection against losses during extreme events.
For example, SPY experienced a maximum drawdown of approximately 55.2% during the 2008 financial crisis and took nearly five years to recover fully from its prior high.
Even when long-term investing offers growth potential, investors need to judge whether they can withstand the losses and waiting periods along the way.
Quantitative trading may offer another return source, but copy trading also entails potential capital loss, execution differences, and strategy failure. Review the relevant terms first.
What matters isn't merely whether you already own ETFs, but whether the new strategy could reasonably complement the portfolio as a whole.
But owning stocks across different companies and building a genuinely diversified portfolio are two distinct objectives.
The former diversifies risk within equities; the latter asks how to reduce total wealth's dependence on common sources of risk.
SPY and QQQ's historical drawdowns are a reminder that even widely diversified equity ETFs can suffer deep losses and long recovery periods during market crises.
Long-term investors should consider not only an asset's potential to grow, but also whether they can tolerate the risks involved in pursuing those returns.
Stocks, bonds, and low-correlation quantitative strategies can serve different purposes.
They need not replace one another; the question is whether they could complement each other in the overall portfolio.
Good allocation isn't about the highest-returning asset; it's about a mix that fits your goals and risk tolerance.
If you already own a broad-market ETF, it may be worth learning about a return source that doesn't always follow the market.
Risk disclosure: This article is for financial education and general information only. It is not personalized investment advice or a guarantee of profit. The A, B, and C allocations and other simulated figures are purely illustrative and do not represent actual strategy performance; the historical SPY and QQQ data refer to specified publicly documented market episodes.
Past performance, correlations, maximum drawdowns, and recovery times do not predict future results. Stocks, bonds, quantitative trading, and copy trading may all result in loss of principal.
Certain strategies carry additional risks, including leverage, liquidity constraints, model failure, and differences in trade execution. Understand each strategy, its trading terms, and all relevant costs before investing.
If you've wondered the same thing, it's a reasonable question.
For many long-term investors, a broad-market ETF is an effective way to build wealth.
It offers exposure to overall market growth without the time-consuming task of selecting individual stocks, while substantially reducing the risk of a single company's failure.
But there's an important question that often gets overlooked:
An ETF diversifies single-stock risk. What diversifies your exposure when the whole market falls?
Even owning several ETFs can mean holding the same companies repeatedly, or exposing your entire portfolio to similar market risks.
History also shows that broad equity ETFs holding hundreds of companies have suffered drawdowns exceeding 50%, followed by recoveries lasting years.
That's why portfolio construction requires an understanding of holding overlap, correlation, and risk management.
Effective diversification isn't simply about owning more products. It's about combining genuinely different sources of return.
Starting with familiar investments such as ETFs and bonds, this article explains company-specific versus market-wide risk, the role of positive and low correlations, and how alternative investment strategies might change a portfolio's overall risk-and-return profile.
Why hundreds of stocks may still leave you exposed
Imagine you own an ETF tracking the S&P 500 Index.Your money is spread across large publicly traded U.S. companies rather than concentrated in one stock.
This type of diversification offers real benefits.
If one company performs poorly, misses earnings expectations, or suffers a steep share-price decline, other holdings may offset part of that loss.
But what happens when the entire market falls?
Think of a recession, financial crisis, runaway inflation, or a broad shift by investors away from risk.
At those times, an ETF holding hundreds of companies can still lose substantial value as the market declines together.
The reason is simple:
ETFs diversify company-specific risk, but they cannot eliminate systematic market risk.
You own shares in many different businesses, yet those businesses remain exposed to common economic conditions and market forces.
It's like putting eggs into hundreds of separate baskets, then loading every basket onto the same truck.
Each basket is less vulnerable on its own, but if the truck overturns, they can all be affected.
Holding many companies helps a broad-market ETF reduce company-specific risk (Scenario A), but a market-wide decline can still expose all holdings to systematic risk (Scenario B).
Three ETFs, but the same stocks?
"Don't put all your eggs in one basket" is the classic analogy for diversification.But three differently named ETFs might own many of the same businesses. That's like using three baskets filled with essentially the same eggs.
Your portfolio might, for example, contain:
- An ETF tracking the S&P 500 Index.
- An ETF tracking the Nasdaq 100 Index.
- A U.S. large-cap growth ETF.
These funds track different indexes or use different selection rules, yet may all own some of the same large technology companies.
If a business appears in multiple ETFs, your actual exposure to that company could be greater than you realize.
Three ETFs do not necessarily provide three independent sources of risk.
Figure: Different ETFs can hold the same companies. Check their underlying holdings and weights rather than judging diversification solely by the number of funds.
Holding overlap isn't the only concern, however.
Even ETFs holding completely different companies can respond to the same interest rates, economic growth, and market sentiment, falling together in a crisis.
So the next portfolio-construction question isn't "How many more stocks can I buy?" but:
Beyond equities, does my portfolio have any other distinct sources of return?
Part Two: Correlation is the key to meaningful diversification
In investing, the correlation coefficient measures the degree of linear relationship between the returns of two assets.Its value ranges from -1 to +1.
Positive correlation: assets tend to rise and fall together
A correlation coefficient near +1 indicates that two assets' returns generally move in closely aligned directions.For example, two ETFs tracking U.S. large-cap stocks may have very similar performance patterns even if they have different names and issuers.
Owning two highly correlated ETFs may add little meaningful diversification.
Negative correlation: when one asset rises, the other tends to fall
A coefficient near -1 indicates that the two assets' returns tend to move in opposite directions.When one performs poorly, the other may move the other way.
Certain combinations of equities and government bonds have displayed negative correlation in particular market environments.
But remember: Stocks and bonds are not always negatively correlated.
During periods of rising inflation and rapidly increasing interest rates, stocks and bonds can decline together.
Whether bonds diversify equity risk therefore depends on the prevailing market environment.
Zero correlation: no clear linear co-movement between assets
A coefficient near 0 means the assets' returns show little obvious linear relationship.For example:
- When stocks rise, a given strategy might rise or fall.
- When stocks fall, that strategy does not necessarily fall with them.
- The strategy's performance may instead be driven by other market factors or trading rules.
This does not mean an uncorrelated strategy cannot lose money, or that it will profit when stocks decline.
Rather, it means:
Its returns need not follow the direction of the equity market.
A correlation coefficient close to zero (r ≈ 0) also does not mean that two assets are completely independent. They may still have nonlinear relationships or suffer losses together during extreme market conditions.
Positively correlated assets (r > 0) tend to move together; negatively correlated assets (r < 0) tend to move in opposite directions; near-zero correlation (r ≈ 0) indicates little clear linear relationship.
For investors already holding substantial broad-market ETF positions, this lack of synchronized movement may be valuable.
Diversification isn't about making every asset rise. It's about avoiding excessive dependence on the same underlying forces.
Already own bonds? Why low correlation still matters
Once you understand correlation, another question naturally follows:"I already own bond funds alongside my ETFs. Isn't that sufficient?"
Combining stocks and bonds is a classic approach to asset allocation.
Equities commonly serve as long-term growth holdings, while higher-quality bonds may provide interest income and moderate equity volatility under some conditions.
But bonds and stocks do not consistently offset one another's risks.
When inflation rises, interest rates adjust rapidly, or market liquidity deteriorates, both may come under pressure.
Even a portfolio containing both equity ETFs and bond funds may therefore remain exposed to shared market forces.
Some investors consequently investigate additional sources of return, such as:
- Market-neutral strategies: Seek to reduce a portfolio's sensitivity to the overall direction of the market.
- Trend-following strategies: Use price trends to identify potential trading directions across markets.
- Multi-market quantitative strategies: Apply systematic rules or statistical models to find trading opportunities in different markets.
- Other alternative investments: Explore assets or strategies whose return drivers differ from those of traditional stocks and bonds.
None of these strategies is automatically better than ETFs or bonds, and not every strategy has low correlation.
They merit research because some may use distinct trading rules, portfolio positions, and risk drivers to offer return opportunities outside traditional equities and fixed income.
Asset allocation cannot prevent losses. It reduces dependence on any one market environment.
ETF + low correlation: Understanding the 1+1>2 effect
This is the article's central idea.Portfolio risk is not simply the sum of the risks of individual holdings. It also depends on how their returns correlate.
Imagine two different sources of return.
Asset A is a broad-market equity ETF, while Asset B is an investment strategy with low correlation to that market.
If Asset B has acceptable risk, costs, and expected returns, an appropriate combination may reduce total portfolio volatility.
Why?
Because the two assets do not necessarily rise or fall at the same time.
When one underperforms, the other might remain relatively stable or follow a different return pattern.
That potential offset is one of the foundations of diversification.
Understanding diversification with simple numbers
Suppose Asset A (a broad-market ETF) and Asset B (a low-correlation strategy) each have annualized volatility of 20%, and their contemporaneous return correlation is zero (ρ = 0).With a 50% allocation to each, the portfolio's theoretical annualized volatility could fall to approximately 14.1%, below the 20% volatility of either asset held alone.
The chart uses hypothetical performance paths to illustrate diversification: Even if Assets A and B both end with positive returns, each may experience substantial swings. Combining assets with low correlation could reduce volatility while maintaining similar expected returns, potentially smoothing the portfolio's growth path.
This is known as the "diversification benefit".
The growth curves are conceptual illustrations, not actual investment performance. Real outcomes depend on asset returns, changing correlations, allocation weights, trading costs, and other risks. Low correlation does not guarantee a profit.
1+1>2 does not guarantee higher profits
Here, 1+1>2 does not mean that investing in two assets doubles your return.The real objective is:
Lower portfolio volatility while targeting a similar expected return.
This may improve a portfolio's "risk-adjusted return", which considers how much risk is taken to earn a given return.
For long-term investors, volatility and maximum drawdown deserve attention alongside cumulative returns.
The challenge isn't only finding investments with long-term profit potential. It's also maintaining a suitable plan when markets become turbulent.
Low-correlation assets alongside broad-market ETFs
Suppose you have built a portfolio around a broad-market ETF.You believe in the long-term case for equities and accept ordinary market fluctuations.
Adding a low-correlation strategy might then be less about increasing returns and more about reducing the portfolio's complete dependence on equity-market performance.
Consider three approaches to compare.
Allocation A: 100% broad-market ETF
The advantages are simplicity, transparency, and typically lower costs, along with full exposure to the performance of the tracked equity market.The drawback is that the portfolio is dominated by equity-market risk. A major correction could cause a corresponding drawdown.
Allocation B: broad-market ETF + bonds
This adds another asset class alongside equities.Higher-quality bonds may generate interest income and improve volatility in some circumstances, but they still carry interest-rate and credit risks, including the possibility that bonds and stocks fall together.
Allocation C: broad-market ETF + low-correlation quantitative strategy
This approach seeks another return driver through trading strategies that are less closely linked to the equity market.If correlation stays relatively low and the strategy itself has reasonable risk-return characteristics, the combination may further improve portfolio efficiency.
Quantitative strategies can nevertheless lose principal and face model failure, liquidity problems, leverage, and execution risk. Historically low correlation is no guarantee of protection during severe market stress.
None of the three allocations is universally superior, and investors do not necessarily have to choose just one of stocks, bonds, and quantitative strategies.
A combination of all three may also deserve consideration.
The chart compares hypothetical maximum drawdowns for three allocations: A (100% broad-market ETF) at −32%, B (ETF + bonds) at −24%, and C (ETF + low-correlation strategy) at −18%.
These hypothetical figures illustrate how different return drivers might soften a portfolio's losses; they are not actual performance results. Real-world effects require verification using historical data.
How severe have SPY and QQQ's historical maximum drawdowns been?
The previous comparisons of A, B, and C were theoretical illustrations.In real markets, however, even equity ETFs diversified across hundreds of companies have experienced declines far greater than many investors expect.
Maximum drawdown (MDD) is the largest peak-to-trough percentage decline of an asset over a specified observation period.
Besides the depth of a decline, investors should ask: How long did it take to fall from peak to trough? And how long did it take to regain the previous high?
Representative historical episodes involving SPY and QQQ offer a more concrete perspective.
Historical data sources:
- Tideline | S&P 500 Bear Markets and Corrections: historical SPY peaks, troughs, drawdowns, and recovery dates.
- AssetsAnalyzer | SPY Drawdown Analysis: additional reference for SPY's historical drawdowns.
- Investors FastTrack | QQQ Maximum Drawdown & Recovery: QQQ's maximum drawdown and recovery dates following the technology bubble.
Notes on the data: These historical figures use adjusted total returns based on daily closing prices with dividends reinvested; month counts are approximate. The periods shown run from peak to recovery for specified market episodes, not the ETFs' average recovery times. The SPY data source is updated through September 30, 2026, and the QQQ source through October 2026. Price-only returns and dividend-reinvested total returns can yield different drawdowns and recovery dates.
As the table shows, SPY lost approximately 55.2% during the 2008 financial crisis, and it took nearly five years to recover fully from its pre-crisis peak.
QQQ's drawdown after the 2000 technology bubble burst reached approximately 83%, and recovering its previous high took close to fifteen years.
By contrast, SPY returned to its previous high roughly six months after the 2020 pandemic crash.
Maximum drawdown shows how deep the fall was; recovery time shows how long investors waited.
For long-term investors, the hardest situations may involve more than emotional strain.
Suppose you're 40 years old and invest US$500 every month in a broad-market ETF.
You understand dollar-cost averaging and are willing to keep investing through market declines.
But if a recession brings both falling stock prices and layoffs, you might suddenly lose your employment income.
Mortgage payments, living expenses, and your children's education costs do not stop.
Without an adequate emergency fund, you might have to sell ETF shares at a loss to cover essential expenses.
Knowing to stay invested is one thing. Having the cash flow to do it is another.
Retirees face a related challenge: making regular withdrawals during a market downturn can leave less invested to participate in a later recovery.
Managing deep drawdowns and cash-flow risk therefore matters alongside estimating investment returns, because it can make a long-term plan more sustainable.
That's why maximum drawdown belongs in any serious asset-allocation assessment.
The right allocation depends on your goals, risk tolerance, investment horizon, and the role each asset plays in the wider portfolio.
Quantitative strategies in an ETF portfolio
If you already own broad-market ETFs, your next investment to investigate need not be another equity ETF.Sometimes the more useful question is:
"Do I need a source of return that doesn't depend on a rising stock market?"
That's a different portfolio-construction perspective Mr.Forex hopes to introduce through quantitative trading strategies.
A return source that need not follow the market
Mr.Forex's quantitative strategies aim to provide return drivers distinct from those of traditional equities.One metric worth reviewing is the historical return correlation between the strategy and the broad market.
If returns are measured over the same period and at the same frequency, a calculated coefficient close to 0 indicates little evident linear co-movement between the strategy and equity-market returns during that observation window.
Such strategies may therefore have portfolio characteristics that differ from conventional equity ETFs.
Historical correlation can change with market conditions, however. A previously weak relationship with equity returns does not ensure the same relationship will continue.
Not replacing ETFs: exploring how investments can complement one another
We do not believe every investor should abandon broad-market ETFs in favor of quantitative trading.ETFs can remain core long-term holdings while quantitative strategies are evaluated as potential additional return sources.
The key comparison is not simply how much money a quantitative strategy made on its own, but:
What happens to your overall risk-and-return profile when that strategy is added to your existing ETF portfolio?
For example:
- Has the original portfolio's volatility decreased?
- Has its maximum drawdown improved?
- Have risk-adjusted returns improved?
- Do those improvements still hold after trading costs?
These are the questions asset allocation should address.
What data should you check before investing?
When evaluating Mr.Forex or any quantitative trading strategy, we recommend looking beyond cumulative returns.Consider these measures together:
- Correlation with the broad market: How closely the strategy's historical returns have moved with equity-market returns, and whether that relationship has remained stable under different conditions.
- Maximum drawdown percentage: The deepest historical decline from a portfolio's net-asset-value peak to a subsequent trough.
- Drawdown recovery time: How long the strategy took to recover from a historical trough to its prior peak, including any drawdowns that have not yet recovered.
- Risk-adjusted return: How much return was achieved relative to the level of risk taken.
- Performance history and data quality: Whether the strategy has experienced different market conditions, and whether reported results come from live trading or backtesting.
- Trading terms and costs: Whether leverage, liquidity, transaction costs, and copy-trading execution differences are consistent with your risk tolerance.
Mr.Forex focuses not on maximizing returns at any cost, but on seeking reasonable returns while working to manage drawdowns and the pressures investors may face along the way.
Focus on risk control, not getting rich overnight.
If you're considering whether a low-correlation quantitative strategy belongs in your portfolio, start by reviewing the performance and risk information Mr.Forex makes available before deciding whether to invest.
Part Seven: Frequently asked questions (FAQ)
Q1: Isn't a broad-market ETF already well diversified?
Broad-market ETFs can effectively diversify single-company risk, but they remain exposed to the performance of the overall equity market.If you want to reduce dependence on equities further, you could research bonds or other low-correlation assets and assess whether they improve your portfolio's risk profile.
Q2: Why can holdings overlap even if I own several ETFs?
Different ETFs may include the same companies because their tracked indexes or stock-selection methods overlap.For example, an S&P 500 ETF, a Nasdaq 100 ETF, and a large-cap growth ETF may all hold some of the same major technology firms.
Look beyond the number of ETFs and examine underlying holdings, portfolio weights, and overall equity-market exposure.
Q3: What is a zero-correlation investment?
Zero correlation means the historical return correlation coefficient between two assets is close to 0, indicating little clear linear relationship.It does not imply that the assets are completely independent or free of loss risk.
Q4: Is zero correlation better than negative correlation?
Not necessarily.Negatively correlated assets may offset some market movements more directly, but the relationship is not always stable.
Zero-correlation assets may instead provide different sources of return.
Both should be assessed alongside expected returns, volatility, costs, and risks in extreme markets.
Q5: Does quantitative trading always have zero correlation with stocks?
No.Quantitative trading simply uses rules, statistical models, or programmatic methods to execute trades.
Different strategies can be positively, negatively, or weakly correlated with equities; their actual performance data must be used to calculate that relationship.
Q6: Does adding a low-correlation strategy always reduce ETF portfolio risk?
No.The outcome depends on the strategy's volatility, its correlation with the ETF, allocation size, and market conditions.
A high-risk strategy can increase total portfolio risk even if its correlation is close to zero.
Lower volatility in typical market conditions also does not guarantee protection against losses during extreme events.
Q7: Why do an ETF's maximum drawdown and recovery time matter?
Maximum drawdown shows how far an investment historically fell from a peak, while recovery time shows how long it took to regain that previous peak.For example, SPY experienced a maximum drawdown of approximately 55.2% during the 2008 financial crisis and took nearly five years to recover fully from its prior high.
Even when long-term investing offers growth potential, investors need to judge whether they can withstand the losses and waiting periods along the way.
Q8: Does quantitative copy trading complement ETFs?
That depends on your financial situation, risk tolerance, and investment objectives.Quantitative trading may offer another return source, but copy trading also entails potential capital loss, execution differences, and strategy failure. Review the relevant terms first.
What matters isn't merely whether you already own ETFs, but whether the new strategy could reasonably complement the portfolio as a whole.
Conclusion: Different return sources, not more ETFs
Broad-market ETFs remain a reasonable foundation for many investors building long-term wealth.But owning stocks across different companies and building a genuinely diversified portfolio are two distinct objectives.
The former diversifies risk within equities; the latter asks how to reduce total wealth's dependence on common sources of risk.
SPY and QQQ's historical drawdowns are a reminder that even widely diversified equity ETFs can suffer deep losses and long recovery periods during market crises.
Long-term investors should consider not only an asset's potential to grow, but also whether they can tolerate the risks involved in pursuing those returns.
Stocks, bonds, and low-correlation quantitative strategies can serve different purposes.
They need not replace one another; the question is whether they could complement each other in the overall portfolio.
Good allocation isn't about the highest-returning asset; it's about a mix that fits your goals and risk tolerance.
If you already own a broad-market ETF, it may be worth learning about a return source that doesn't always follow the market.
Explore another source of returns beyond ETFs
Review the historical performance of Mr.Forex's quantitative strategies, their correlation with equities, maximum drawdowns, recovery times, and other risk measures to consider whether they might complement your existing ETF portfolio.Risk disclosure: This article is for financial education and general information only. It is not personalized investment advice or a guarantee of profit. The A, B, and C allocations and other simulated figures are purely illustrative and do not represent actual strategy performance; the historical SPY and QQQ data refer to specified publicly documented market episodes.
Past performance, correlations, maximum drawdowns, and recovery times do not predict future results. Stocks, bonds, quantitative trading, and copy trading may all result in loss of principal.
Certain strategies carry additional risks, including leverage, liquidity constraints, model failure, and differences in trade execution. Understand each strategy, its trading terms, and all relevant costs before investing.




 繁體中文
 العربية
 বাংলা
 简体中文
 香港中文
 Čeština
 Dansk
 Nederlands
 English
 Français
 Deutsch
 Ελληνικά
 हिन्दी
 Magyar
 Bahasa Indonesia
 Italiano
 日本語
 한국어
 Bahasa Melayu
 Norsk bokmål
 Polski
 Português do Brasil
 Português
 Română
 Русский
 Español de Argentina
 Español de México
 Español
 Svenska
 ไทย
 Türkçe
 Українська
 اردو
 Tiếng Việt